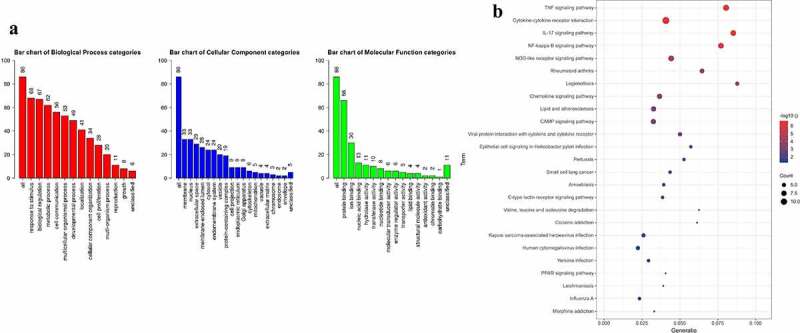
Figure 3.

Analyze the GO and KEGG pathway enrichment of 86 DEGs. (a) Bar chart showed results of Biological process (red), Cellular component (blue), and Molecular function (green). (b) Bubble diagram showed the KEGG pathways enrichment results. The size of the dot represents count, and color represents -log10 adjusted p value.
