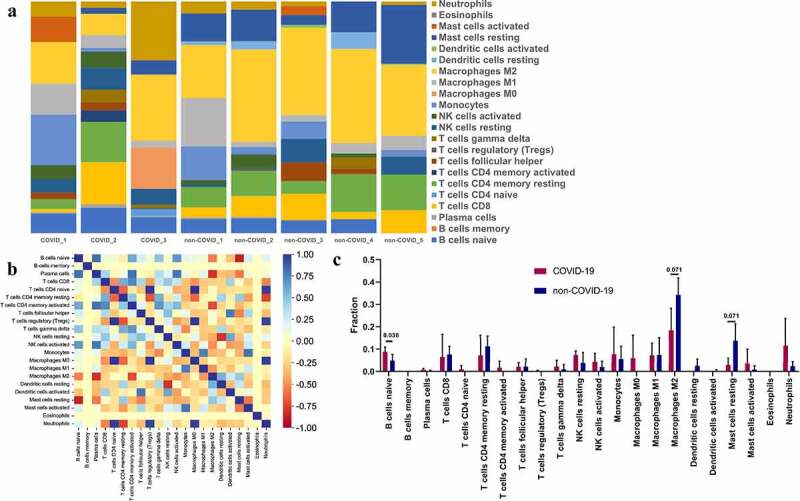
Figure 7.

Immune infiltration in SARS-CoV-2 infected heart. (a) Barplot showed the composition of immunocytes in SARS-CoV-2 infected hearts and uninfected hearts. A total of 22 immune cells were included. (b) Heatmap showed the Pearson correlation between 22 kinds of immunocytes. The blue represented positive correlation, red represented negative correlation and yellow represented no correlation between two cells. (c) The content of 22 types of immunocytes in hearts of COVID-19 and none-COVID-19 patients were compared. Propotion of ‘B cells naïve’ was significantly higher in COVID-19 hearts than in control hearts.
