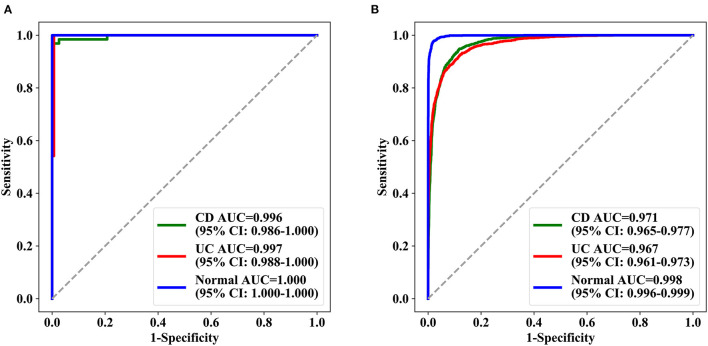
Figure 3.
ROC curves achieved by deep model ROC of the three categories of deep learning model in the test set. (A) The test results of three groups of patients and (B) the test results of the lesions (signal picture). AUC represents the area under the ROC curve, and in parentheses is the 95% confidence interval of AUC. AUC, the area under the receiver operating characteristic curve; ROC, receiver operating characteristic.

