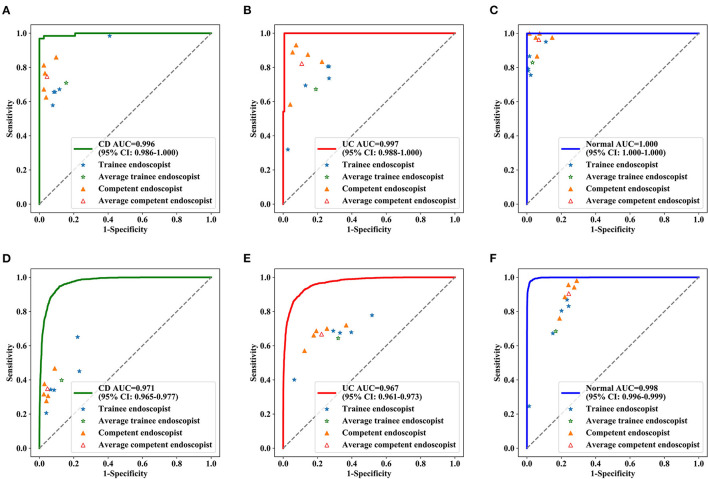
Figure 4.
Diagnostic performance of deep model and endoscopists in the test dataset. ROC curve for CD (A), UC (B) and normal (C) at the patient level, ROC curve for CD (D), UC (E), and normal (F) at lesions level. The blue stars indicate the diagnostic sensitivities and specificities of the trainee endoscopists, the green star indicates the pooled sensitivities and specificities of all trainee endoscopists, the yellow triangles indicate the diagnostic sensitivities and specificities of the competent endoscopists, and the red triangle indicates the pooled sensitivities and specificities of all competent endoscopists. AUC, the area under the receiver operating characteristic curve; ROC, receiver operating characteristic.

