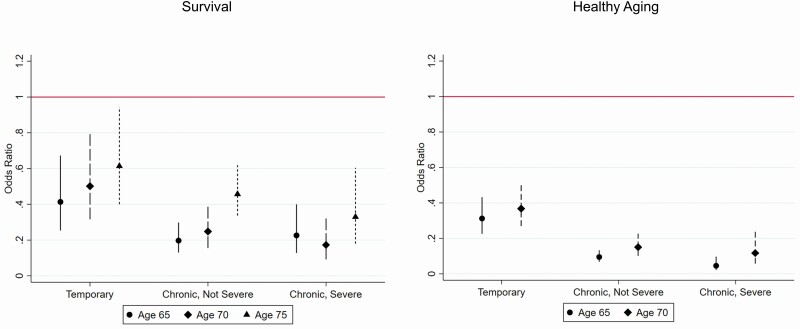
Figure 1.
Odds ratios of healthy aging and survival for midlife experiences with work limitations. Source: Authors’ calculations using PSID core and restricted mortality data. Notes: Coefficients are based on the preferred logistic model (Model 1) in all cases. Relevant odds ratios reported in Tables 2 and 3, column 1 and Supplementary Table A1, columns 2–3, Supplementary Table A2, column 2. PSID = Panel Study of Income Dynamics.

