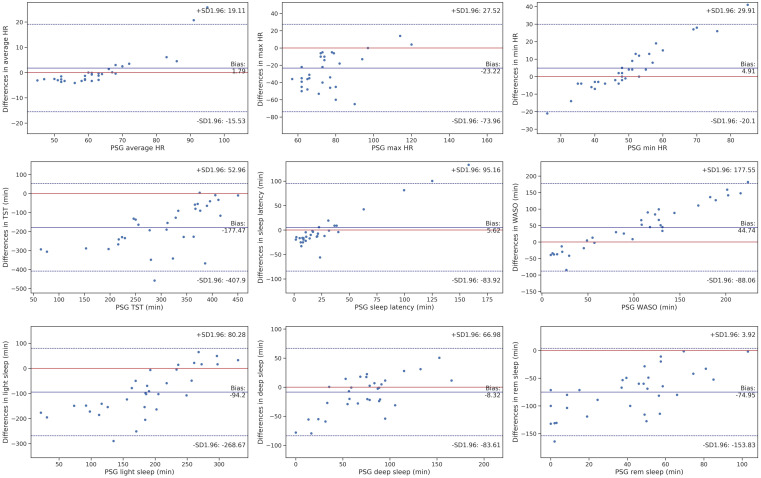
Figure 1. Bland-Altman plots for HR and main sleep outcomes.
PSG-EMFIT QS discrepancies for sleep outcomes (y-axis) are plotted as a function of the PSG outcomes (x-axis) for each individual. Circles represent individuals. Biases are marked as a solid blue line. The blue dotted lines refer to the upper and lower Bland-Altman plots agreement limits, and the red solid line indicates no bias. HR = heart rate, max = maximum, min = minimum, PSG = polysomnography, QS = quantified sleep, rem = rapid eye movement, SD = standard deviation. TST = total sleep time, WASO = wake after sleep onset.

