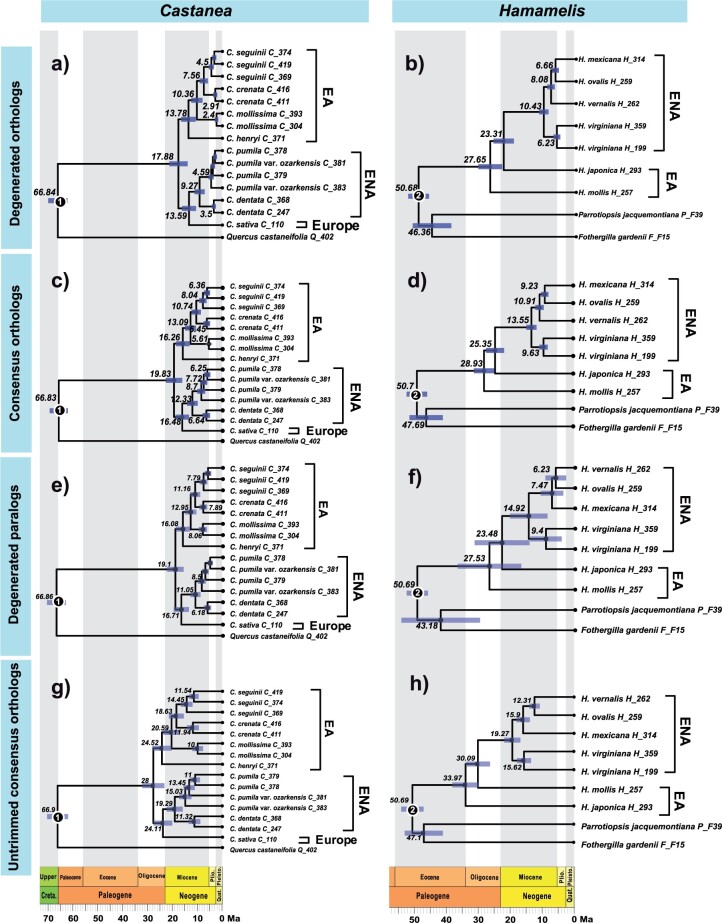
Figure 5.
Results of divergence times (median) of Castanea (left column) and Hamamelis (right column) estimated using different Hyb-Seq data. a) and b), the results are from PPD-generated orthologous data. c and d), results are from “consensus” data through HybPiper and PPD trimming steps. e and f), the results are from PPD-generated paralogous data. g and h) results are from “consensus” data without any trimming steps. The number at each node represents the median divergence time, while the node bars represent its 95% HPD. Circle 1 represents the fossil calibration of Castanea, while circle 2 represents the fossil calibration of Hamamelis. All topologies were drawn by ggtree in R. EA = eastern Asia; ENA = eastern North America.

