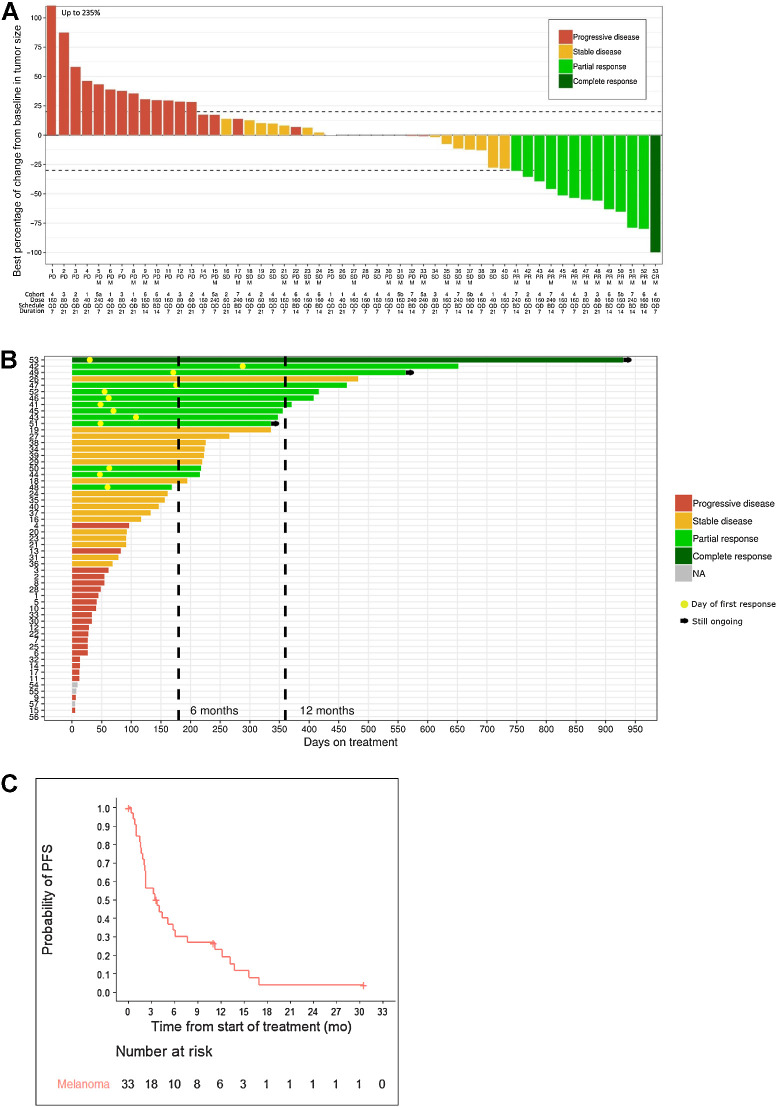
Figure 2.
The drug-efficacy data. A, Waterfall plot of best percentage of change in sum of target lesions in the full analysis set. The y-axis represents the percentage of maximum tumor reduction assessed according to RECIST v1.1 criteria. M, melanoma. The bars are coded by best overall response; B, Swimmer plot showing duration of treatment. The bars are coded by best response as in A. The yellow circle in responders indicates the day of first response. C, PFS (N = 33).

