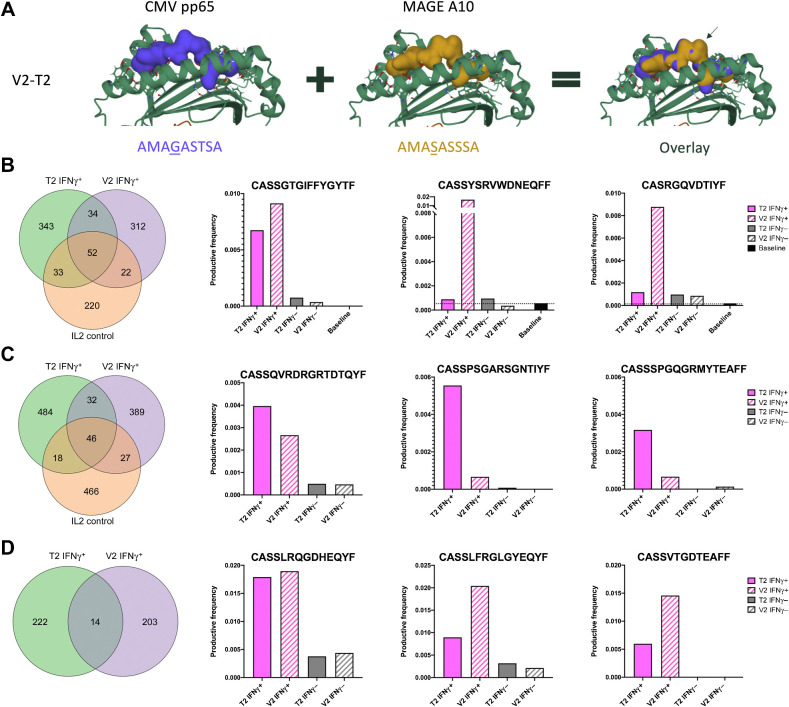
Figure 6.
T-cell cross-reactivity between viral and tumor antigens sharing a high degree of homology. A, Docking overlay of the V2 and T2. B, Cross-reactive T-cell clones generated using healthy donor PBMCs. C, Cross-reactive T-cell clones generated using PBMCs isolated before initiation of anti-PD1 therapy from a patient with metastatic melanoma (patient 18). D, Cross-reactive T-cell clones generated using PBMCs isolated before initiation of anti-PD1 therapy from a patient with metastatic melanoma (patient 17). B–D, Venn diagrams represent the number of shared clones in IFNγ-positive CD8+ T cells between the indicated settings. The bar plots represent the three clones with the highest productive frequency among the IFNγ-positive CD8+ T cells that were expanded after T2 and V2 stimulation, but not when stimulated with IL2 alone. Pink bars represent the productive frequency in IFNγ-positive CD8+ T-cell pool, grey bars represent the productive frequency in the IFNγ-negative CD8+ T-cell pool, and black bar represents the productive frequency in baseline CD8+ T cells without any experimental stimulation. Black dotted line represents the baseline productive frequency of each clone.

