Figure 1.
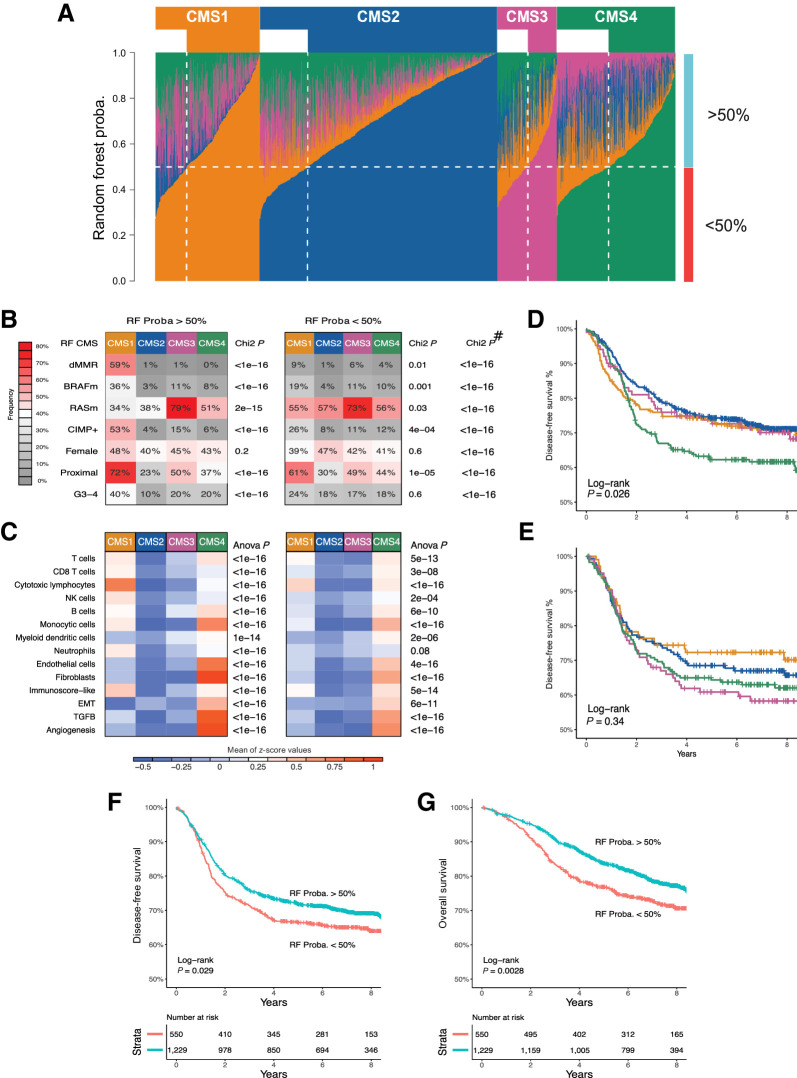
RF CMS classification, characterization, and survival impact based on related probability. A, Fraction of votes (probability) of the RF classification for each of the four CMSs within each of the 1,779 samples (columns), summing up to one for each sample. Samples are grouped according to RF-predicted CMS. The horizontal dotted white line indicates an RF probability of 50%. The vertical dotted white line delimits, within each CMS, samples with low (<50%) versus high (>50%) probability of CMS assignment according to RF classifier. B, The proportions of samples with dMMR, BRAF mutated (BRAFm), KRAS/NRAS mutated (RASm), CIMP+, female gender, proximal location, and G3/G4 grade are shown according to CMS with either high (left) or low RF probability (right). # indicates the P values of the χ2 tests comparing the distribution of values of each variable between RF > 50% and RF < 50% samples. C, Heatmaps showing the mean scores for eight immune and two stromal cell populations infiltration (based on MCP-counter estimates), a surrogate of the Immunoscore (Immunoscore-like), and three pathways are shown according to CMS with either high (left) or low RF probability (right). The P values of the t test comparing the distribution of values of each variable between RF > 50% and RF < 50% samples are displayed in the extended data Supplementary Table S3. DFS curves according to RF-predicted CMS in PETACC8 samples, based on RF probability of class assignment above 50% (D) or below 50% (E). Kaplan–Meier curves of DFS (F) and OS (G) are shown according to low (<50%) versus high (>50%) RF probability (whatever the predicted CMS). CMS color codes: CMS1 (orange), CMS2 (blue), CMS3 (purple), CMS4 (green).

