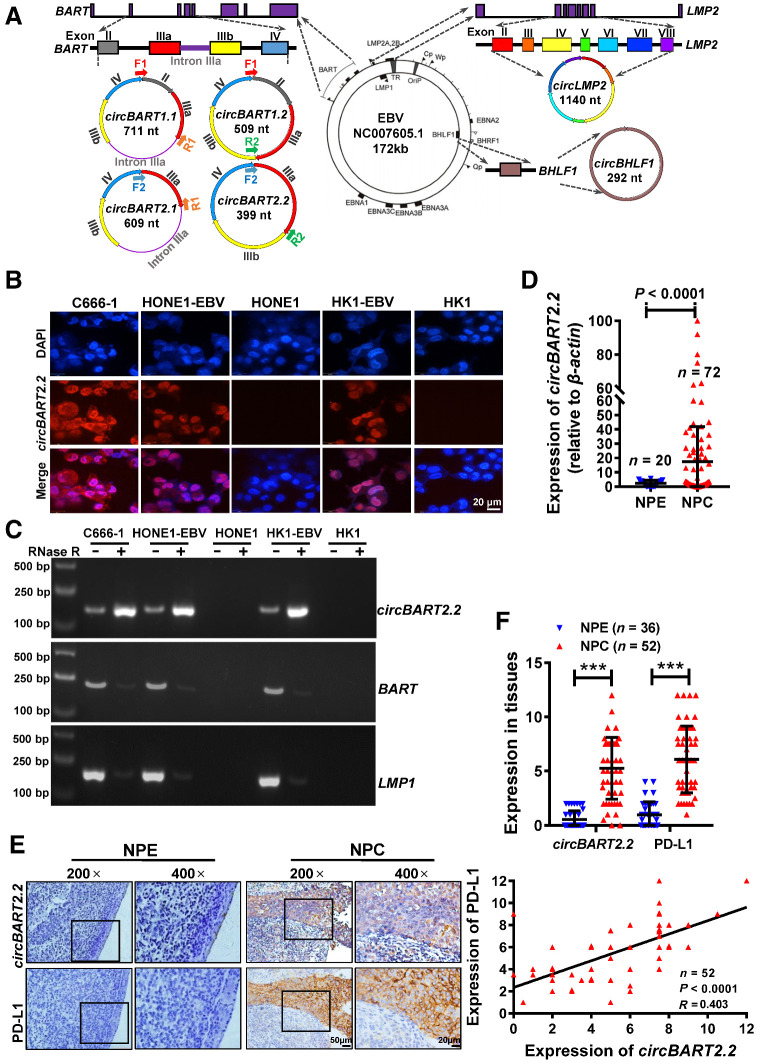
Figure 1.
EBV-encoded circBART2.2 was highly expressed in NPC and positively correlated with PD-L1. A, Schematic diagram of EBV-encoded circRNAs in EBV (NC007605.1, 172 kb). The LMP2 gene encodes circLMP2 (1140 nt), and BHLF1 encodes circBHLF1 (292 nt). The BART gene encodes four different circBARTs: circBART1.1 (711 nt, including exons II, IIIa, IIIb, and IV and intron IIIa), circBART1.2 (509 nt, including exons II, IIIa, IIIb, and IV), circBART2.1 (609 nt, including exons IIIa, IIIb, and IV and intron IIIa), and circBART2.2 (399 nt, including exons IIIa, IIIb, and IV). F1, F2, R1, and R2: primer sites for detecting circBARTs are indicated. B, Intracellular localization of circBART2.2 (red) in the EBV-positive NPC cell lines C666-1, HONE1-EBV, and HK1-EBV, as determined by FISH using a biotin-labeled circBART2.2 probe. EBV-negative HONE1 and HK1 were used as the negative controls. Nuclei were stained with DAPI (blue). Magnification, ×400. Scale bar, 20 μm. C, The stability of circBART2.2 was detected in RNase R–treated C666-1, HONE1-EBV, and HK1-EBV cells for 24 hours by qPCR. EBV-negative HONE1 and HK1 were used as negative controls. The linear BART and LMP2 mRNA were also used as controls. D, circBART2.2 expression was measured in 72 NPC tissues and 20 noncancerous nasopharyngeal epithelial (NPE) tissue samples by RT-PCR. β-Actin was used as an internal reference (P < 0.0001). E, Representative images of circBART2.2 and PD-L1 expression in 52 NPC tissues and 36 noncancerous NPE tissues by in situ hybridization for circBART2.2 and IHC for PD-L1 protein. Magnification, ×200; scale bar, 50 μm; ×400; scale bar, 20 μm. F, Statistical analysis of the expression and correlation of circBART2.2 and PD-L1 according to the expression in 52 NPC tissues and 36 noncancerous NPE tissue samples by in situ hybridization or IHC. ***, P < 0.001.

