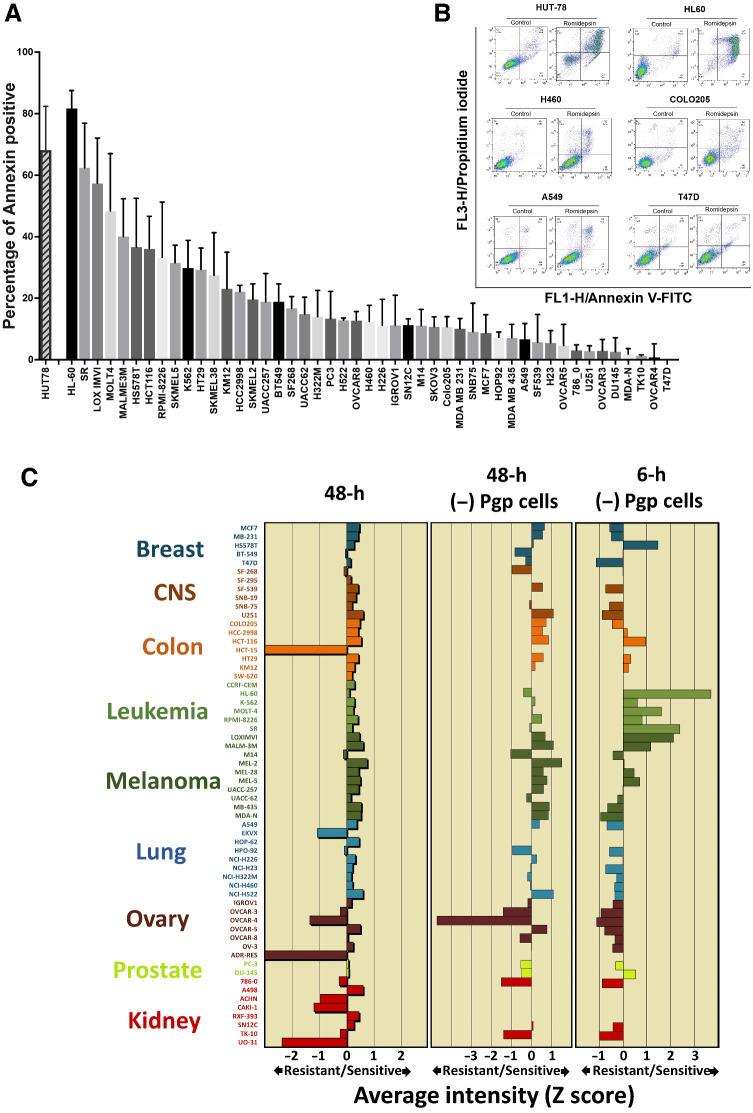
Figure 1.
Different sensitivity spectrum of the NCI drug screen collection in 6- versus 48-hour assays. A, Analysis of apoptotic cell death in NCI-60 cell lines and HUT-78 following romidepsin treatment. Annexin V–positive cells were determined by flow cytometry. Results are baseline mean ± SD from three independent experiments. Each bar represents percentage of increase in cell death compared with untreated control. B, Representative histograms quantitating Annexin staining. C, A graphical representation of z-score of sensitivity of tumor cells to romidepsin following treatment. Drug sensitivity profiles in the NCI-60 cell lines plotted as mean graphs. In these profiles, the mean IC50 value for all cell lines is plotted as the center line. Then the difference in IC50 value for each cell line from the mean is plotted, as Z-scores, with the bars to the left indicating resistance and the bars to the right indicating sensitivity. Left, mean graph showing results following treatment with romidepsin in the conventional NCI-60 48-hour assay. Middle, eliminating cell lines previously shown to express Pgp (SF-295, HCT-15, SW-620, CCRF-CEM, EKVX, HOP-62, NCI-ADR-RES, A498, ACHN, CAKI-1, RXF-393, UO-31) in the 48-hour assay. Right, mean graph showing results of a 6-hour drug exposure after removing the Pgp-expressing cells.

