Figure 2.
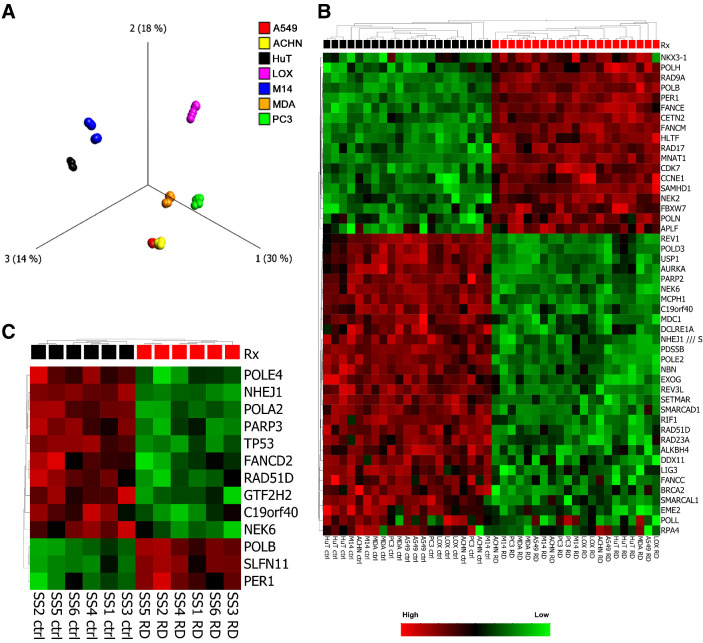
Gene expression profiling shows impact on DNA repair genes. A, PCA plot showing that samples separate primarily into cell-specific clusters, rather than by treatment. The PCA plot is based on the 1851 probe sets that were found to be most variable across samples [applying a Variance filter of 0.4 sigma/sigma max (s/smax) >0.4 to maximize the projection score]. Samples are colored according to the cell line. B, Heat map and unsupervised 2-way hierarchical clustering of DEGs involved in DNA damage repair (DDR) pathways. Clustering is based on 47 DNA repair genes (out of 252) with P < 0.05, and expression fold change of >1.5-fold. Cell line removed as factor. Primary clustering according to romidepsin 6 hours Rx. C, Heat map and unsupervised 2-way hierarchical clustering of DEGs involved in DDR pathways from patients with Sezary syndrome treated with romidepsin for 24 hours. Clustering is based on 13 DNA repair genes (out of 252) with P < 0.05, and expression fold change of >2-fold.

