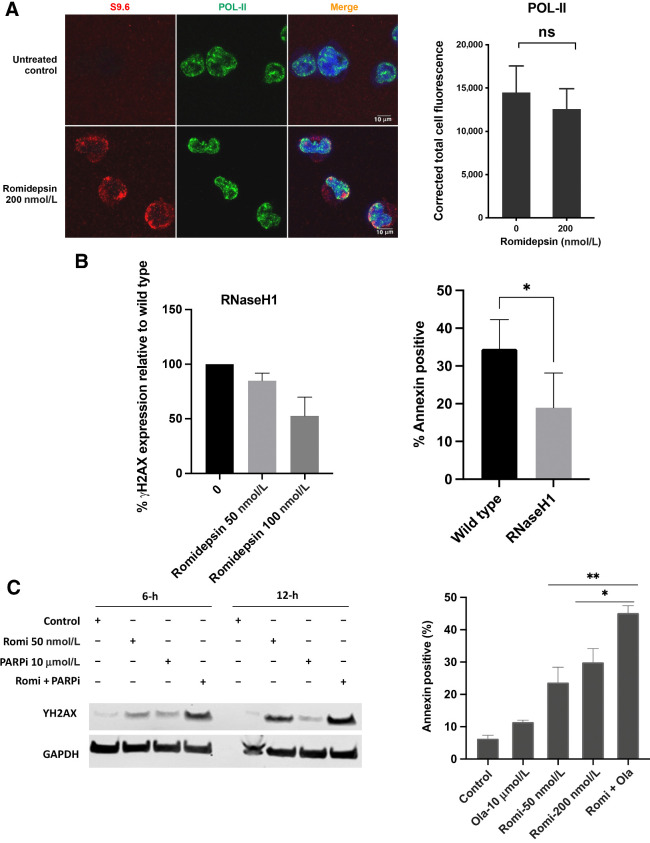
Figure 7.
A, Co-localization of accumulated R-loops in the romidepsin treated cells with POL-II. Quantification of nuclear POL-II. Immunofluorescence signal in LOXIMVI cells treated with or without romidepsin for 6 hours. For each protein signal was quantified only in the nuclear regions, defined by DAPI staining. The median of the signal intensity per nucleus is shown; *, P < 0.01; ns, not significant (t test, two‐tailed). B, left, Analysis of γ-H2AX in the RNaseH1-transfected LOXIMVI cell line following romidepsin treatment. γ-H2AX signal was detected by western blot assay and quantified using Image Studio Software, the percentage of decrease in the expression of γ-H2AX signal relative to the wild-type parental cells is shown here. Treatment was for 6 hours followed by incubation in drug-free medium an additional 6 hours. B, right, Analysis of apoptotic cell death in both RNaseH1 transfected and wild-type (parental) LOXIMVI cell lines following romidepsin treatment. Annexin V–positive cells were determined by flow cytometry. Results are baseline mean ± SD from three independent experiments. Each bar represents percentage of increase in cell death compared with untreated control. *, P < 0.04 (t test, two‐tailed). C, LOXIMVI cells treated with romidepsin 50 nmol/L, PARP-inhibitor olaparib (10 μmol/L) and combination of romidepsin and olaparib for 6 hours and harvested immediately (6 hours) or incubated an additional 6 hours before harvest (12-hour time point). The presence of γ-H2AX signal was detected by western blot assay (left). Analysis of apoptotic cell death in the LOXIMVI cell line following treatment with romidepsin (50 and 200 nmol/L), olaparib alone (10 μmol/L), and 50 nmol/L romidepsin in combination with 10 μmol/L olaparib. Annexin V–positive cells were determined by flow cytometry (right).

