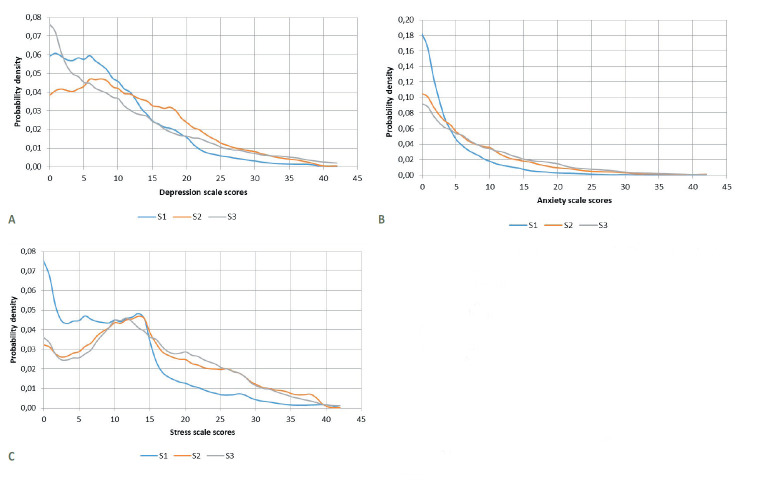
Figure 3.
Kernel density charts of scores on the Depression, Anxiety, and Stress Scales in each survey. Panel A. DASS Depression scale scores. DASS – Depression, Anxiety, and Stress Scales; S – Survey. Kruskal-Wallis χ2 = 426.39, df = 2, P < 2.2-16- Pairwise comparison (Wilcoxon rank sum test with continuity correction): S1 ≠ S2 ≠ S3, P < 0.001. Panel B. DASS Anxiety scale scores. DASS – Depression, Anxiety, and Stress Scales; S – Survey. Kruskal-Wallis χ2 = 1434.8, df = 2, P < 2.2-16. Pairwise comparison (Wilcoxon rank sum test with continuity correction): S1 ≠ S2 ≠ S3, P < 0.001. Panel C. DASS Stress scale scores. DASS – Depression, Anxiety, and Stress Scales, S – Survey. Kruskal-Wallis χ2 = 1202.1, df = 2, P < 2.2-16. Pairwise comparison (Wilcoxon rank sum test with continuity correction): S1 ≠ S2 and S1 ≠ S3, P < 0.001. S2 = S3. Estimation of the probable density of DASS-21 scale scores and graphical representation of their distribution in each survey.

