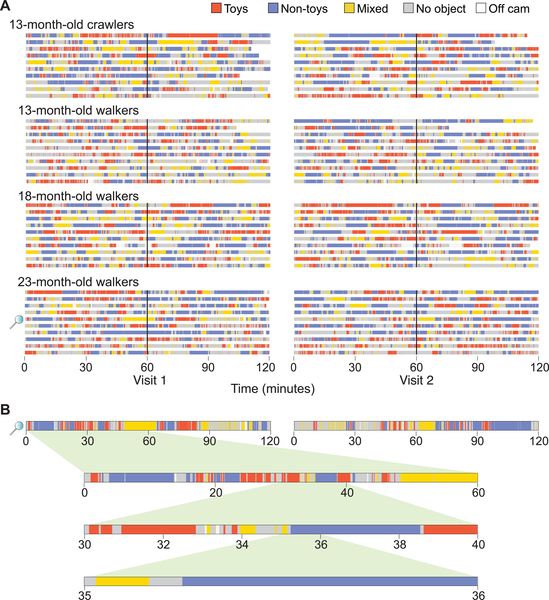
Figure 1.
(A) Timelines for each infant’s interactions with objects across the two-hour observations on each visit. Timelines are ordered from most to least time interacting with objects for each age group. Orange bars denote bouts with toys; blue bars denote bouts with non-toys; yellow bars denote bouts that involved both toys and non-toys; grey bars denote time off objects; white bars denote time off camera. (B) Timeline of a representative 23-month-old infant across four hours (top row); each subsequent row shows detailed representations of object interactions by zooming in on 1 hour (second row), 10 minutes (third row), and 1 minute (bottom row).

