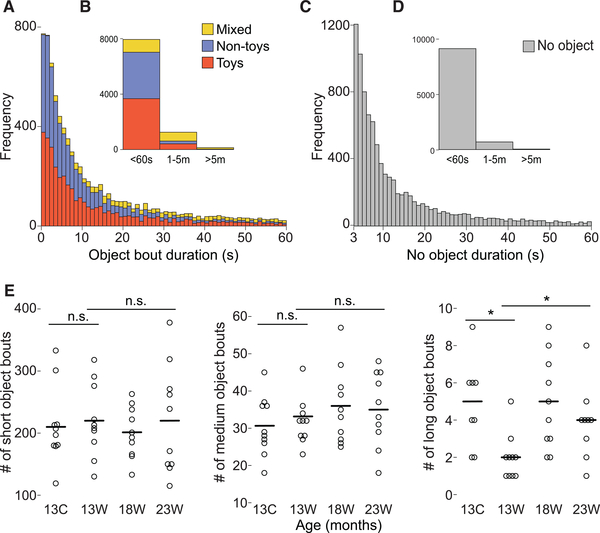
Figure 2.
Frequency histograms of bout durations aggregated across infants. (A) Frequencies of object bouts < 60 s. (B) Frequencies of bouts < 60 s, 1 min to 5 min, and > 5 min. (C) Frequencies of bouts when infants were off objects for < 60 s. (By definition, breaks could not be shorter than the 3-sec criterion). (D) Frequencies of bouts when infants were off objects < 60 s, 1 min to 5 min, and > 5 min. (E) Frequency of short (< 1 min), medium (1–5 min) and long (>5 minutes) object bouts by locomotor status (C = crawlers, W = walkers) and age. Each circle represents one infant’s data. Horizontal lines represent group averages.

