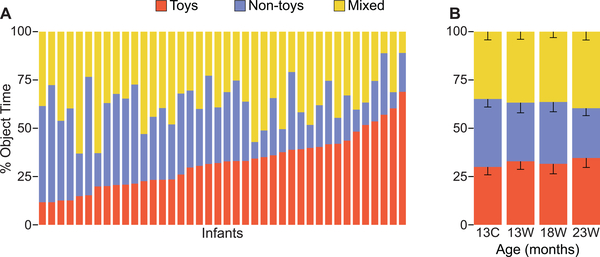
Figure 5.
(A) Individual data for interactions with different categories of objects. Each bar represents one infant, ordered from the infant who spent the least amount of time interacting with toys to the infant who spent the most amount of time interacting with toys. (B) Average time interacting with toys, non-toys, or a mix by locomotor status (C = crawlers, W = walkers) and age.

