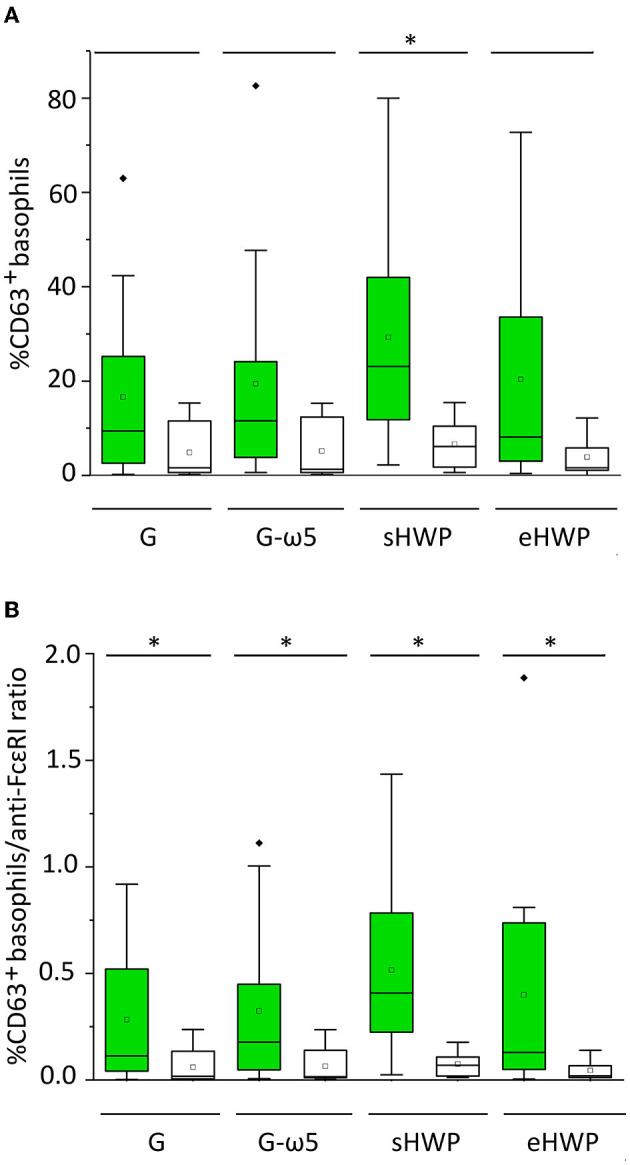
Figure 3.

Basophil activation in patients (green) and controls (white). Allergen test solutions from gluten G and G-ω5 and from sHWPs and eHWPs were used. (A) %CD63+ basophils, (B) %CD63+ basophils/anti-FcεRI ratio. Significant differences between patients and controls are indicated by asterisks (one-way ANOVA, Dunn's post-hoc test, p < 0.05). There were no significant differences between patients' reactivity to different ATS. Diamonds indicate individual outliers outside the first or third quartiles. Squares represent the mean and lines the median. Whiskers mark the 1.5 interquartile range. The box corresponds to the range in which the middle 50% of the data are located.
