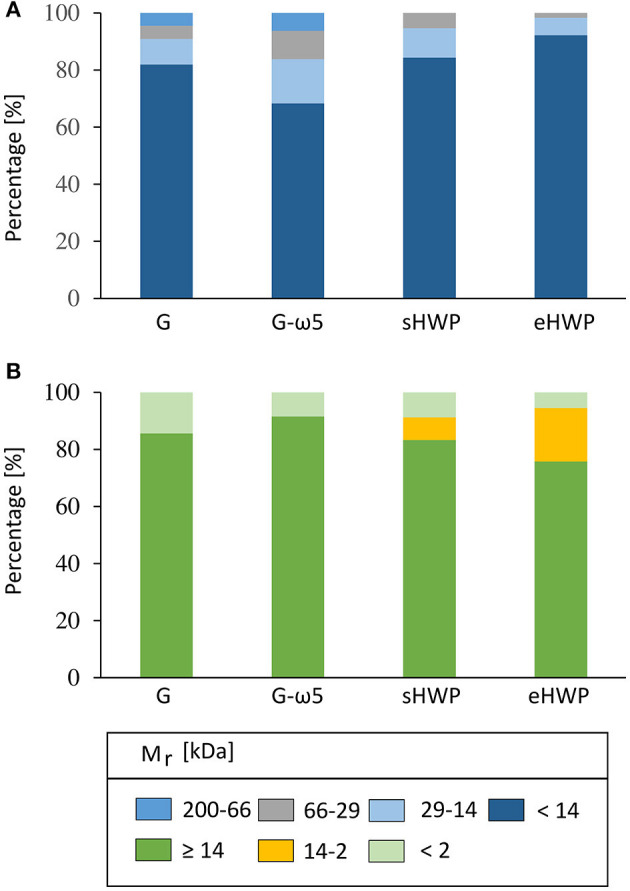
Figure 5.

Gel-permeation high-performance liquid chromatography (GP-HPLC). Relative molecular mass distribution (Mr) [%] of the allergen test solutions from gluten G and G-ω5 and from sHWPs and eHWPs. Areas within each fraction were set by marker substances. Two different systems were used. (A) 1: 200–66 kDa; 2: 66–29 kDa; 3: 29–14 kDa; 4: <14 kDa. GP-HPLC; (B) 1: ≥14 kDa; 2: 14–2 kDa; 3: <2 kDa.
