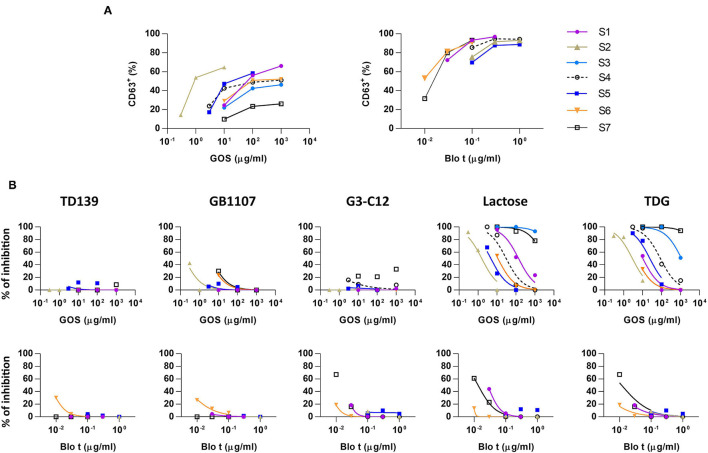
Figure 1.
Basophil activation assays to galacto-oligosaccharide (GOS) and Blomia tropicalis (Blo t) in the absence or presence of galectin inhibitors. (A) Dose response curve for the expression of CD63 upon GOS or Blo t stimulation. Heparinized whole blood was stimulated with various concentration of GOS (n = 7) or Blo t (n = 6). The expression of CD63 on basophils was analyzed by flow cytometry. (B) Dose response curve for the expression of CD63 upon GOS or Blo t stimulation in the presence of 50 μM of TD139 (n = 5), 50 μM of GB1107 (n = 5), 50 μM G3-C12 (n = 6), 100 mM of lactose (n = 7 for GOS; n = 6 for Blo t), or 50 mM TDG (n = 7 for GOS; n = 6 for Blo t).

