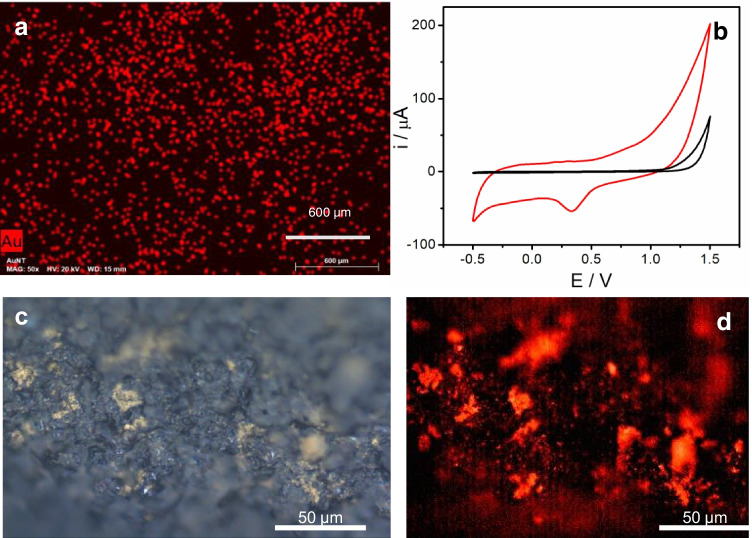
Fig. 2.
a SEM–EDX image of a magnification of AuNTs/CSPE. Scale bar corresponds to 600 µm. b Cyclic voltammograms from − 0.5 to 1.5 V (vs Ag ref. electrode) of a CSPE (black line) and an AuNTs/CSPE (red line) in 0.1 M H2SO4. Scan rate: 100 mVs−1. c Optical microscope white light and d fluorescence images of TAMRA-Probe-SH/AuNTs /CSPE. Fluorescence signal is only detected in the yellowish areas (left) where Probe-SH/ AuNTs are present

