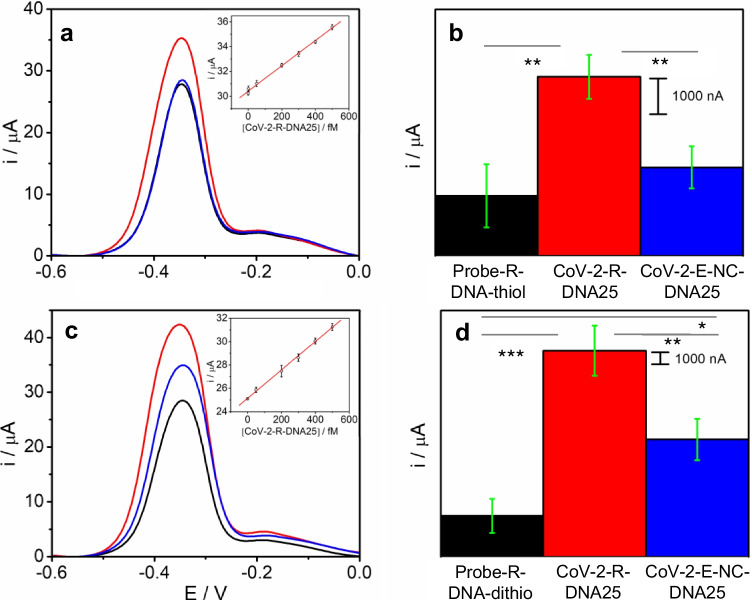
Fig. 3.
DPVs (a, c), bar diagrams (b and d), and calibration plots (inset of a and c) of the peak current of AA accumulated (measured at − 0.23 V (vs Ag ref. electrode)) on a Probe-R-DNA- thiol/AuNT/CSPE (a, b) or Probe-R-DNA-dithio/AuNT/CSPE (c, d) before (black line) and after hybridization with 500 fM: complementary CoV-2-R-DNA25 (red line) and a non-complementary CoV-2-E-NC-DNA25 (blue line) sequences in PB 0.1 M pH 7.0. Scan rate: 10 mV s−1. Data are presented as mean ± SD (n = 3) in terms of intensity. Statistical analysis was performed using one-way ANOVA with Tukey’s test (pairwise comparison). Significant codes: 0 “***” 0.001 “**” 0.01 “*” 0.05 “.” 0.1 “” 1 “.”

