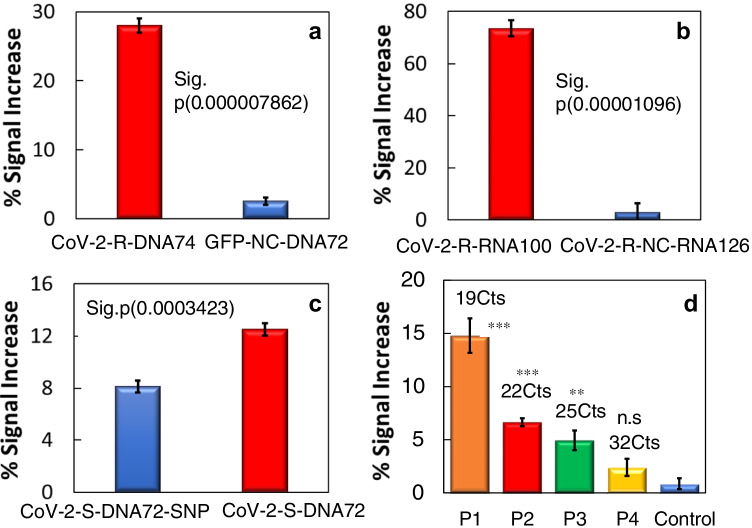
Fig. 4.
Bar diagrams of the % signal increase after the hybridization with 50 fM: a 74 nts CoV-2-R-DNA74 complementary sequence or GFP-NC-DNA72 non-complementary sequence; b CoV-2-R-RNA100 sequence or CoV-2-R-NC-RNA126 non-complementary sequence; c SNP (CoV-2-S-DNA72-SNP) and complementary (CoV-2-S-DNA72) sequence and d samples of SARS-CoV-2 infected patients P1 (19 Cts), P2 (22 Cts), P3 (25 Cts), P4 (32Cts) and non-infected patient used as control (Control). Data are presented as mean ± SD (n = 3) in terms of relative signal increase vs the control. Statistical analysis was performed using either ANOVA (Tukey’s test) or Student’s T test. Significant codes: ANOVA 0 “***” 0.001 “**” 0.01 “*” 0.05 “.” 0.1 “” 1 “.” and T test p value < 0.05 (sig)

