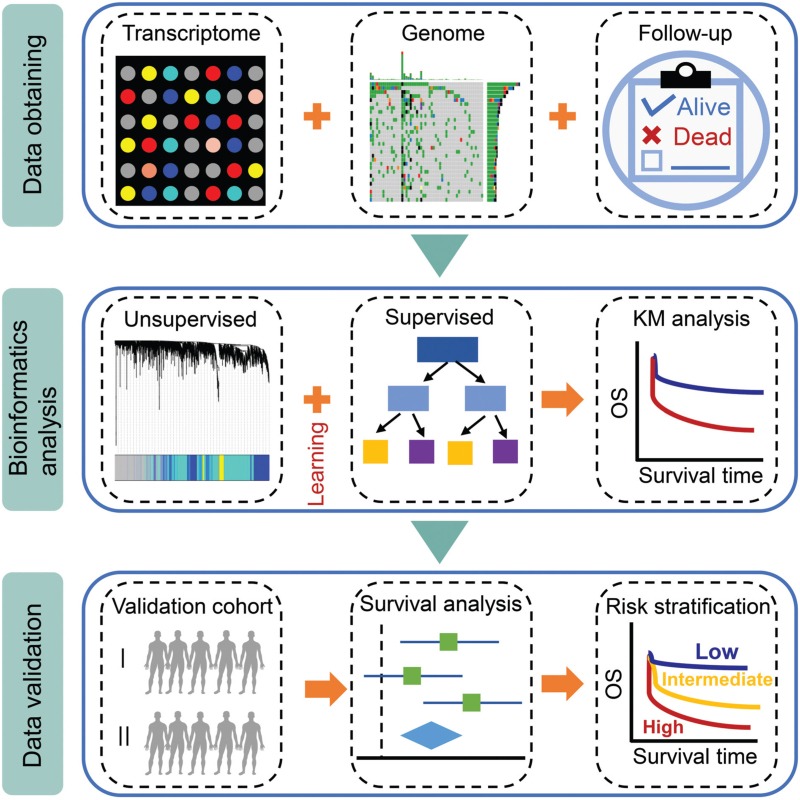
Figure 1.
Schematic diagram of the commentary. The transcriptome data, genomic sequencing data, and follow-up information are obtained to perform unsupervised and supervised learning, and Kaplan–Meier (KM) curve analysis is then conducted. Next, publicly available databases or clinical samples are used to validate the results of bioinformatics analyses. Finally, based on the above results, survival analysis and risk stratification of patients with hematological malignancies are performed.

