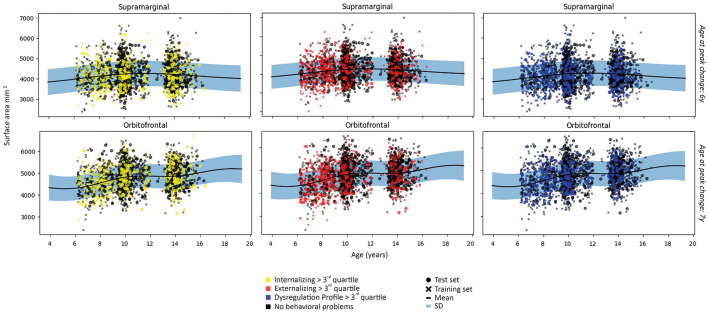
Figure 7.
Examples of patterns of surface area for each subject in the first fold and the fit of the normative model to the surface area in the training set. A wider prediction range outside of data distribution is used for visualization purposes. For illustrative purposes, measures are rescaled to the original means and standard deviations.

