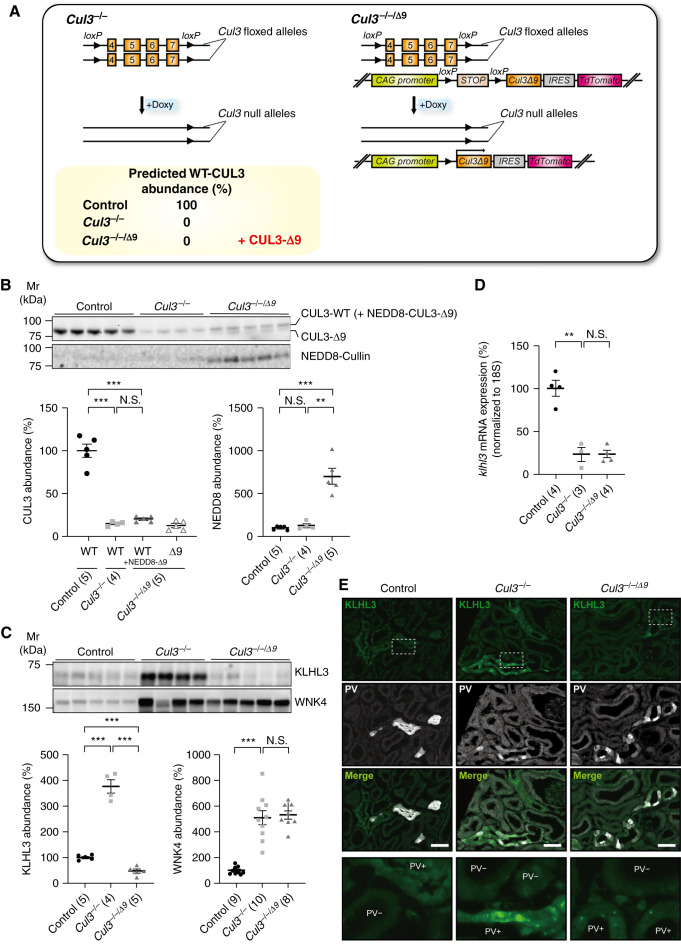
Figure 3.
CUL3-Δ9 prevents cytoplasmic accumulation and aggregation of KLHL3 along the distal convoluted tubule (DCT) in Cul3−/− mice. (A) Tubule-specific Cul3−/− mice were made by generating mice with two “floxed” Cul3 alleles and the Pax8-rtTA-LC1 system (left). To express CUL3-Δ9 on the Cul3−/− background (Cul3−/−/Δ9 mice), a transgene fragment consisting of a strong synthetic promoter (CAG) promoter, a floxed transcription blocker (STOP), cDNA encoding Cul3 Δ403–459 (CUL3-Δ9), an internal ribosome entry site (IRES), and cDNA encoding the fluorophore tdTomato was introduced (right). Doxycycline treatment is predicted to completely ablate CUL3 expression in both Cul3−/− and Cul3−/−/Δ9 mice, and induce CUL3-Δ9 expression in Cul3−/−/Δ9 mice. (B) Doxycycline-induced Cul3 deletion and CUL3-Δ9 expression. Controls were uninduced Cul3fl/fl mice, administered 5% sucrose in drinking water. Western blotting showed that both doxycycline-induced Cul3−/− and Cul3−/−/Δ9 mice displayed significantly lower CUL3 abundance than controls. Total CUL3 expression did not differ between Cul3−/− and Cul3−/−/Δ9 mice. CUL3-Δ9 expression was detected only in Cul3−/−/Δ9 mice. Western blotting for NEDD8 showed higher abundance in Cul3−/−/Δ9 mice. Note that neddylated CUL3-Δ9 runs at the same Mw as WT CUL3. (C) Western blotting revealed that Cul3−/− mice displayed significantly higher KLHL3 protein abundance compared with controls, but Cul3−/−/Δ9 mice did not. WNK4 protein abundance was greatly increased in both Cul3−/− and Cul3−/−/Δ9 mice indicating loss of CUL3-mediated WNK4 degradation in both models. (D) Quantitative real-time PCR revealed significantly lower Klhl3 mRNA expression in Cul3−/− mice, but expression was similar between Cul3−/− and Cul3−/−/Δ9 mice. Individual values and mean±SEM are shown, with n in parentheses. Statistical differences were examined by one-way ANOVA, followed by post hoc unpaired t tests with Bonferroni correction. **P<0.01; ***P<0.001; N.S., P>0.05. (E) Immunofluorescence revealed cytoplasmic accumulation of KLHL3 (green) and aggregation along DCT1 (PV [D, white] of Cul3−/− mice (middle), whereas KLHL3 was only detected in small aggregates in Cul3−/−/Δ9 mice (right). Representative image, three mice total were analyzed with similar results. Areas marked by rectangles are enlarged at the bottom. Scale bars: 50 µm.

