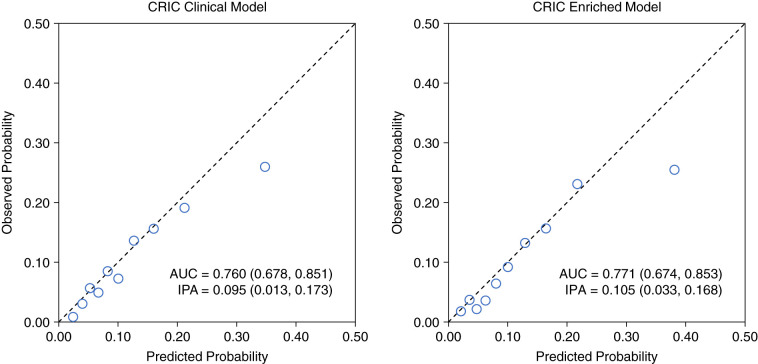
Figure 2.
Discrimination and calibration of risk prediction models for ASCVD in CKD. Results were obtained by aggregating predicted probabilities from 10 × 10-fold cross-validation and then assessing their discrimination (AUC), calibration (predicted probability versus observed events, with each circle representing a decile of predicted probability), and overall goodness of fit (IPA). Observed probability was estimated using the cumulative incidence function accounting for the competing risk of death. Higher values for AUC (95% CI) and IPA (95% CI) indicate better performing models.

