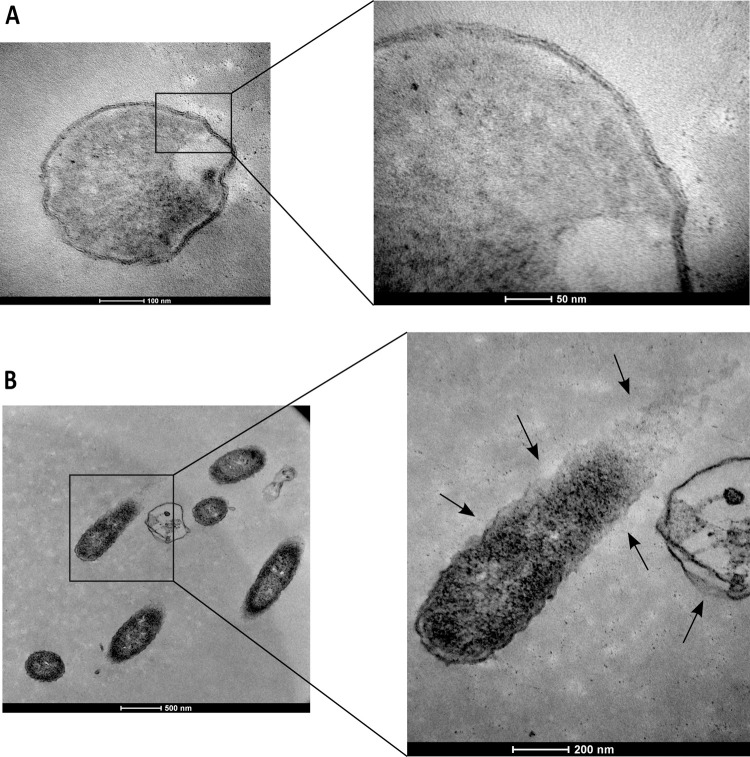
Fig 7. Transmission electron microscopic micrographs depicting the effect of HICA on the cell morphology of Pseudomonas aeruginosa ATCC25668.
The cells were treated with sterile water (untreated control) (A) or with 4 mg/mL HICA for 120 min (B). Higher magnification of the square region in the left image is provided on the right. Arrows show the locations of the breakage of cell envelope and the release of cellular content.

