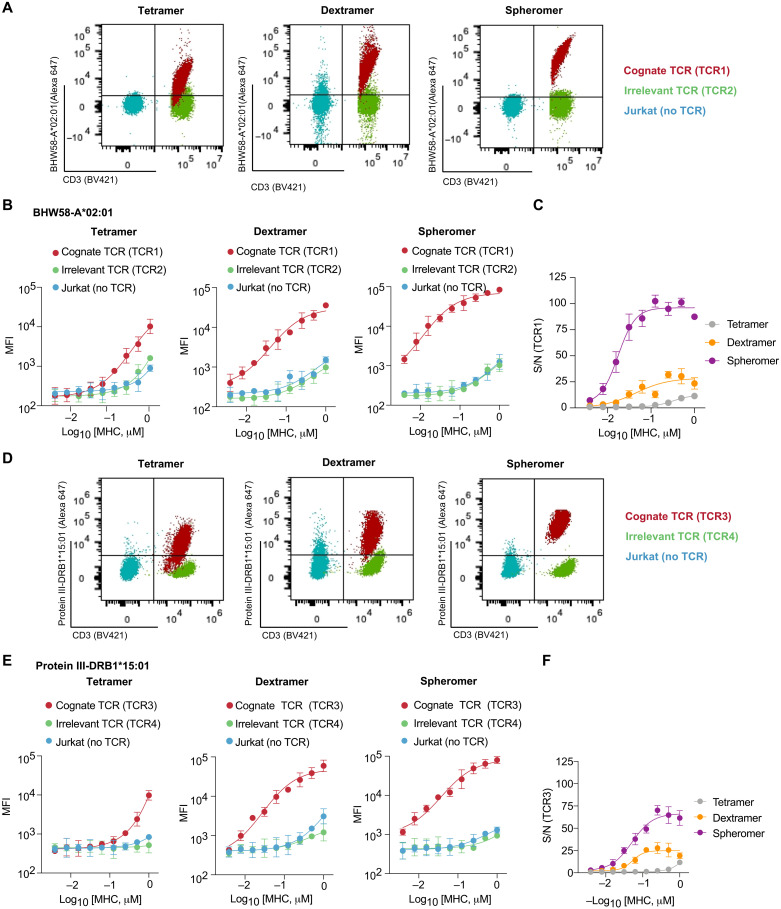
Fig. 3. Spheromer binds T cell lines expressing MHC-I– or MHC-II–restricted TCRs with high specificity.
(A) Representative flow cytometry plots showing the binding of the indicated BHW58-A*02:01 formulations with equivalent pMHC concentration to a T cell line expressing TCR1. The nonspecific binding of the different formulations was measured using untransduced Jurkat cells and a cell line expressing an irrelevant TCR. CD3 was measured as proxy for TCR expression. (B) Quantification of BHW58-A*02:01 binding measured by flow cytometry (mean ± SD). The experiment was performed with each sample processed in duplicates and repeated at least twice. (C) Signal-to-noise ratio (S/N) of TCR1 binding to distinct BHW58-A*02:01 multivalent formulations. Mean ± SD of the measurements from two independent experiments has been plotted. (D) Representative flow cytometry plots showing the binding of the indicated protein III-DRB1*15:01 formulations with equivalent pMHC concentration to a T cell line expressing TCR3. The nonspecific binding to Jurkat cells and an irrelevant TCR was also measured. CD3 was measured as proxy for TCR expression. (E) Quantification of protein III-DRB1*15:01 binding (mean ± SD) measured by flow cytometry. (F) The signal-to-noise ratio (S/N) of TCR3 binding to distinct protein III-DRB1*15:01 multivalent formulations (mean ± SD).

