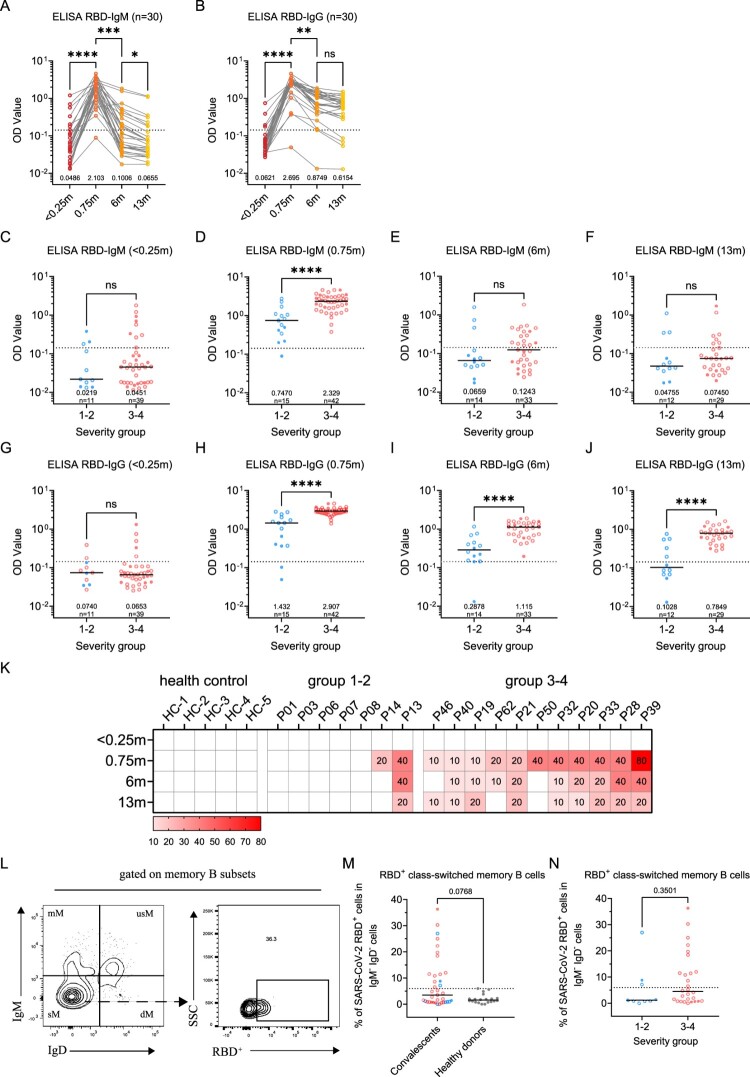
Figure 2.
Dynamic changes of SARS-CoV-2 circulating antibodies and the memory B cells responses at 1-year after infection. Four times sampling (<0.25, 0.75, 6, and 13 m) were conducive for patients. (A-B) Continuous monitoring of the RBD-IgM and RBD-IgG levels (ELISA) in the four indicated time points based on consecutive sampling to 30 subjects. Friedman test with subsequent Dunn’s multiple comparisons was performed. The dotted line represents the cut-off value. (C-F) The RBD-IgM levels were compared between group 1–2 (milder) and group 3–4 (severer) patients, shown as data from discontinuous monitoring to all patients. Mann-Whitney test was performed. Median values and the number of subjects are shown above the X-axis. Blue-filled circles, blue-hollow circles, red-hollow circles, and red-filled circles represent the patients of groups 1, 2, 3, and 4, respectively. The dotted line represents the cut-off value. (G-J) The RBD-IgG levels were compared, similar analysis and labelling as RBD-IgM. (K) The heatmap of the neutralization antibody levels, shown as the highest dilutions that has neutralization activity. (L) The gating strategy of RBD+ class-switched memory B cells. (M-N) The comparisons of RBD+ class-switched memory B cells between convalescents and healthy donors (M), and between the mild and severe groups (N). Mann-Whitney test was performed. Grey circles represent the healthy donors; coloured circles have the same meaning as above.

