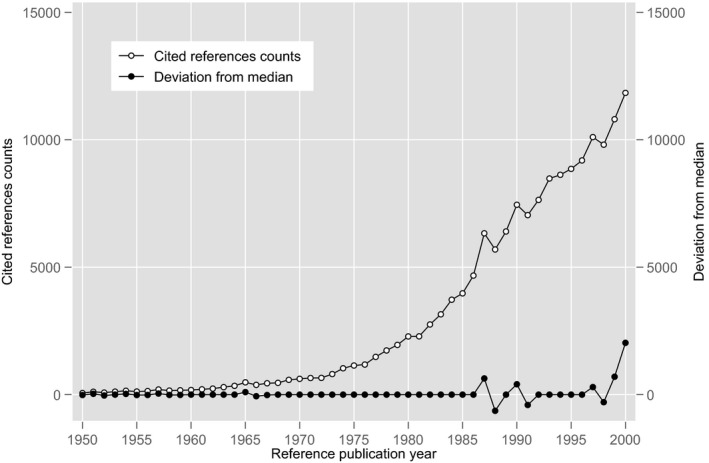
FIGURE 1.

Number of cited references (open circles ー○ー) and median deviations of the cited references (closed circles ー●ー). The peaks with positive values show each reference publication year (RPY) with a significantly greater number of cited references than the bordering 2 y before and after it. This figure focuses on the years from 1950 to 2000
