FIGURE 2.

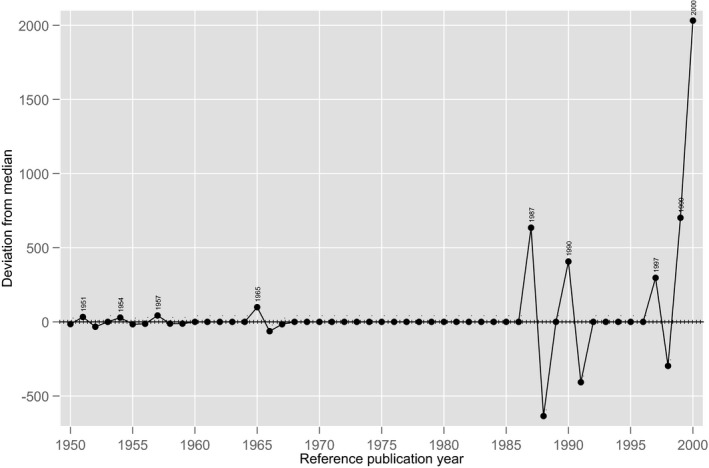
Median deviations of the cited references. The peaks (with positive values) show cited reference years with a significantly greater number of cited references than bordering 2 y. This figure focuses on the years 1950 to 2000

Median deviations of the cited references. The peaks (with positive values) show cited reference years with a significantly greater number of cited references than bordering 2 y. This figure focuses on the years 1950 to 2000