
Figure 3.
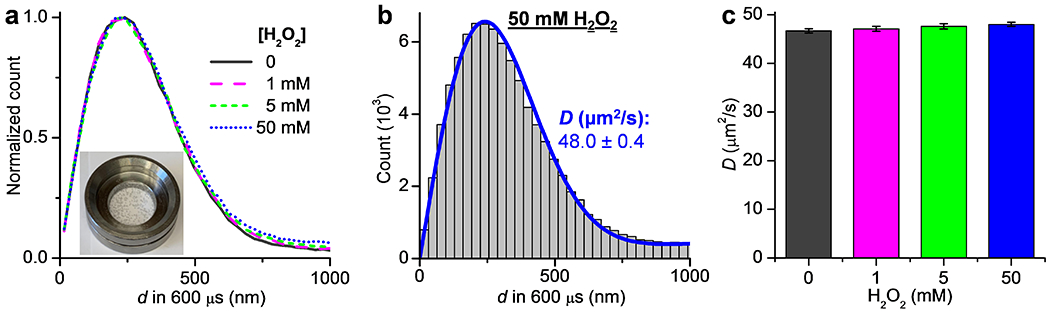
No substantial change in single-molecule displacements observed for catalase under turnover. (a) Normalized count distributions of the measured 600-µs single-molecule displacements for Cy3B-labeled catalase diffusing in PBS buffers with H2O2 added at 0, 1, 5, and 50 mM. Inset: photo of a sample with 50 mM H2O2, showing the generation of bubbles from the catalytic reaction. (b) Histogram: the count distribution with the 50 mM H2O2 solution. Blue line: MLE yielding D = 48.0±0.4 µm2/s (95% confidence interval). (c) MLE-determined D at the different substrate concentrations. Error bars: 95% confidence intervals of MLE.