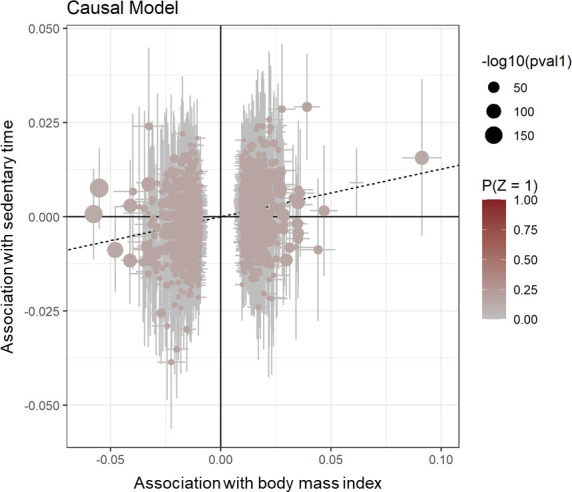
Appendix 1—figure 1. Scatter plot for CAUSE test statistics on the causal association between BMI and sedentary time.

Effect estimates for body mass index (x-axis) are plotted against estimates for sedentary time (y-axis). Error bars indicate 95% confidence intervals and the dotted line indicates the median causal effect of BMI on sedentary time.
