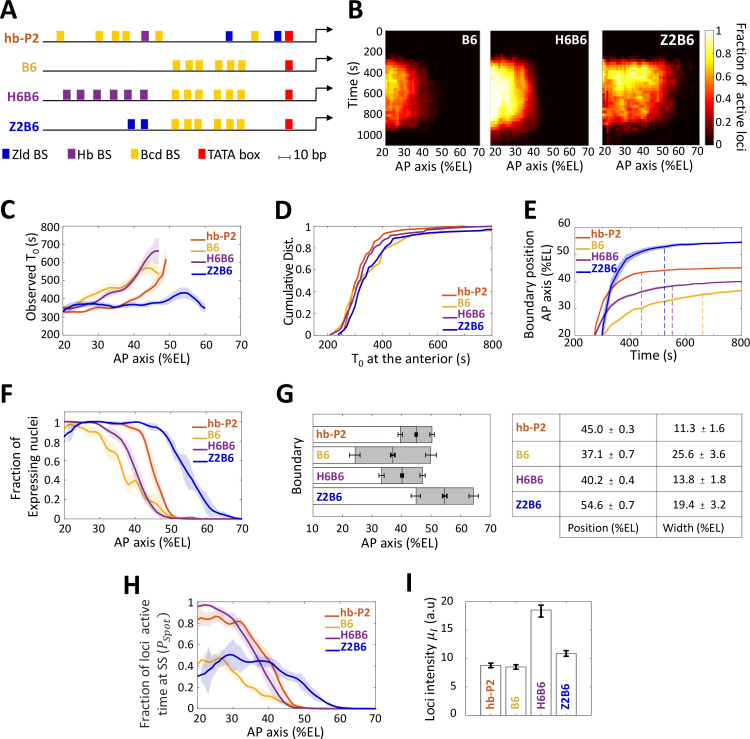
Figure 3. Transcription dynamics of the B6, H6B6, and Z2B6 reporters.
(A) Arrangement of the binding sites for Bcd (yellow), Hb (purple), and Zld (blue) upstream of the TATA box (red) and the TSS (broken arrow) of each reporter. (B) Kymographs of mean fraction of active loci (colormap on the right) as a function of time (Y axis in s) and nuclei position along the AP axis (X axis in %EL) at nc13. (C) Mean time of first spot appearance T0 (s) along the AP axis with shaded standard error of the mean and calculated only for loci with observed expression. (D) Cumulative distribution function of T0 (s) at the anterior (20% ± 2.5%EL). (E) Boundary position (as %EL) of fraction of nuclei with MS2 signal along AP axis, with shaded 95% confidence interval, as a function of time. The dash vertical curves represent the time to reach the final decision boundary position ( ± 2 %EL). (F) Fraction of nuclei with any MS2 signal along the AP axis (%EL) with shaded standard error of the mean. (G) Boundary position and width were extracted by fitting the patterns fraction of expressing nuclei, (F) with a sigmoid function. Bar plots with 95% confidence interval for boundary position and width as the grey region placed symmetrically around the boundary position. Average values and confidence intervals are indicated in the adjacent table. (H) Fraction of loci active time () at steady state (time window of 600–800 s into nc13) as a function of nuclei position along AP axis. (I) Mean intensity () with standard error of active fluorescent loci detected in the anterior region (~20% ± 2.5% EL) at steady state. (C–I) reporter data are distinguished by color: hb-P2 (orange, n = 5 embryos), B6 (yellow, n = 5 embryos), H6B6 (purple, n = 7 embryos), and Z2B6 (blue, n = 3 embryos).


