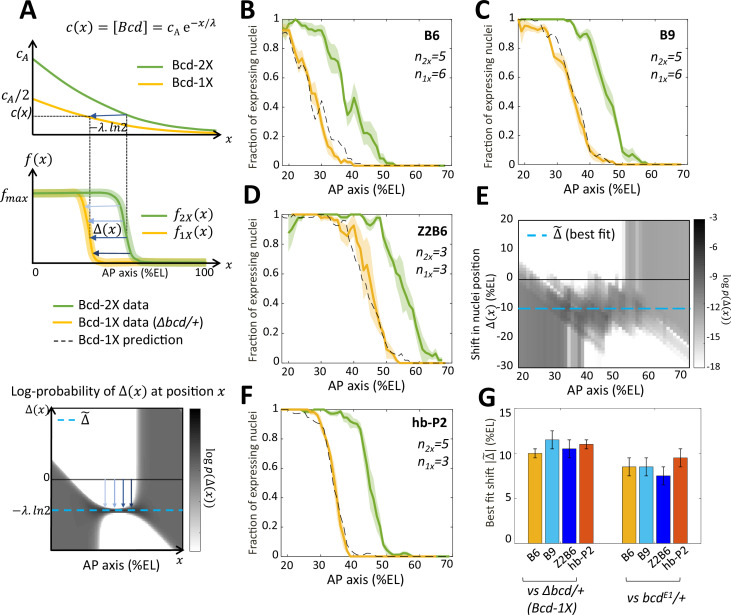
Figure 4. Bicoid thresholds measurements by the Bcd-only synthetic reporters.
(A) Modeling the pattern shifts between Bcd-2X and Bcd-1X embryos. Top: The Bcd concentration gradient along the AP axis with its exponential decay length λ. At the anterior pole, Bcd concentration is in Bcd-2X embryos (solid green line) and in Bcd-1X embryos (solid yellow line). The distance between any two nuclei columns in Bcd-2X and Bcd-1X that have the same Bcd concentration (blue horizontal arrow) is given by . Middle: along the AP axis, expression pattern of a Bcd-dependent reporter in Bcd-2X embryos (, solid green line) and in Bcd-1X embryos ( solid yellow line). : the shift in position (blue horizontal arrows) from a nuclei column in Bcd-2X embryos at position to one at Bcd-1X embryos with the same expression level, such that . Bottom: Cartoon of log-probability map of the shift based on the expression patterns in Bcd-2X and Bcd-1X (i.e. and ). Its value is represented on the grey scale. The blue vertical arrows denoting the shift correspond to the horizontal arrows with similar shade observed in the middle panel. If the Bcd gradient is the only source of positional information for the expression patterns, then the best fit value of given the probability map is (horizontal blue dashed line). (B–D and F) Expression patterns of B6 (B), B9 (C), Z2B6 (D) and hb-P2 (F) reporters in embryos from wild-type (Bcd-2X, solid green lines with shaded errors) and Δbcd/+ (Bcd-1X, solid yellow lines with shaded errors) females. In each panel, the numbers of embryos for each construct and condition are also shown. Prediction of Bcd-1X patterns from the Bcd-2X patterns assuming a fitted constant shift (values in panel G) are shown as dashed black lines. (E) Log-probability map () of the shift (in %EL) at a given nuclei position in Bcd-2X embryos (, in %EL), extracted from combined B6, B9, and Z2B6 reporters’ data. The horizontal cyan dashed line represents the best fit value = 10.5 %EL from the log-probability map. (G) Comparison of the shift, with 95% confidence interval, in nuclei position from wild-type embryos to embryos from Δbcd/ + females (left bars) and from wild-type embryos to embryos from bcdE1/ + females (right bars) fitted individually to B6, B9, Z2B6 and hb-P2 reporters’ data.


