. 2022 Apr 1;11:e67598. doi: 10.7554/eLife.67598

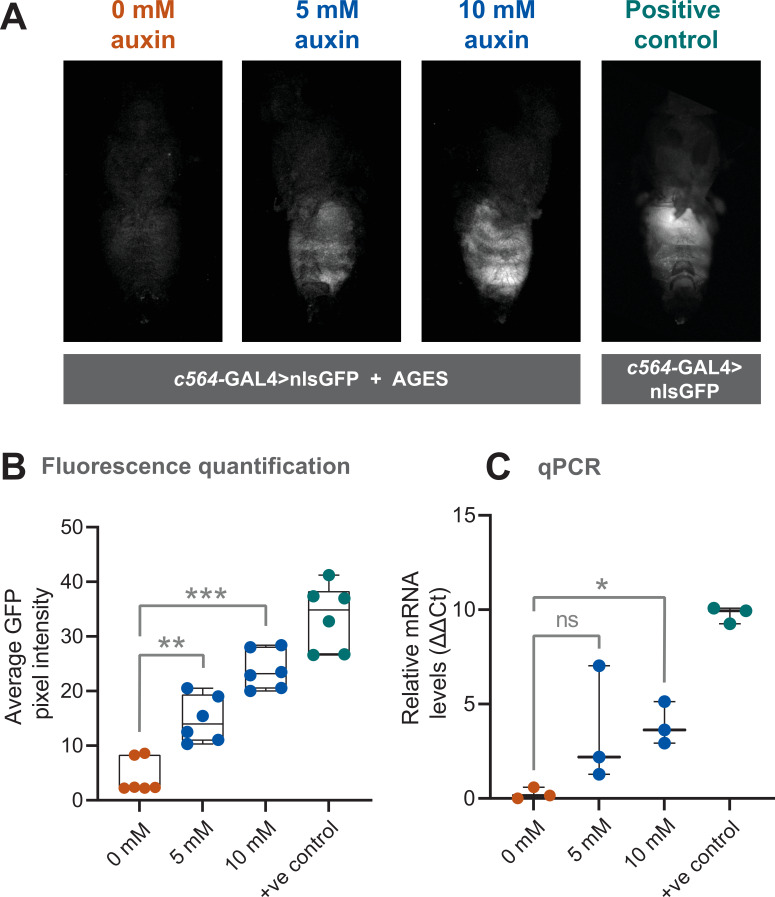
Figure 2. Auxin-inducible gene expression system (AGES) effectively induces GAL4 activity in Drosophila adults.

(A) Ventral images of live females that express GAL4 in fat body tissue. Ingestion of food containing auxin (≥5 mM for 24 hr) induces GAL4 activity and the expression of GFP. (B) Quantification of GFP levels. Pixel intensity thresholding was performed to isolate abdomens as regions of interest. The average pixel intensities from six replicates were quantified and analysed using Kruskal-Wallis test with Dunn pair-wise comparison (***, p < 0.001 and **, p < 0.01). (C) Quantitative PCR (qPCR) data for GFP mRNA levels using different concentrations of auxin (three biological replicates). Values were normalised to housekeeping gene RpL4 (Ribosomal Protein L4) and relative expression levels (compared to the negative control) were calculated using the ΔΔCt method. Y-axis displaying ΔΔCt values and statistics done using Kruskal-Wallis test with Dunn pair-wise comparison (*, p < 0.05). See Figure 2—source data 1 for raw data.

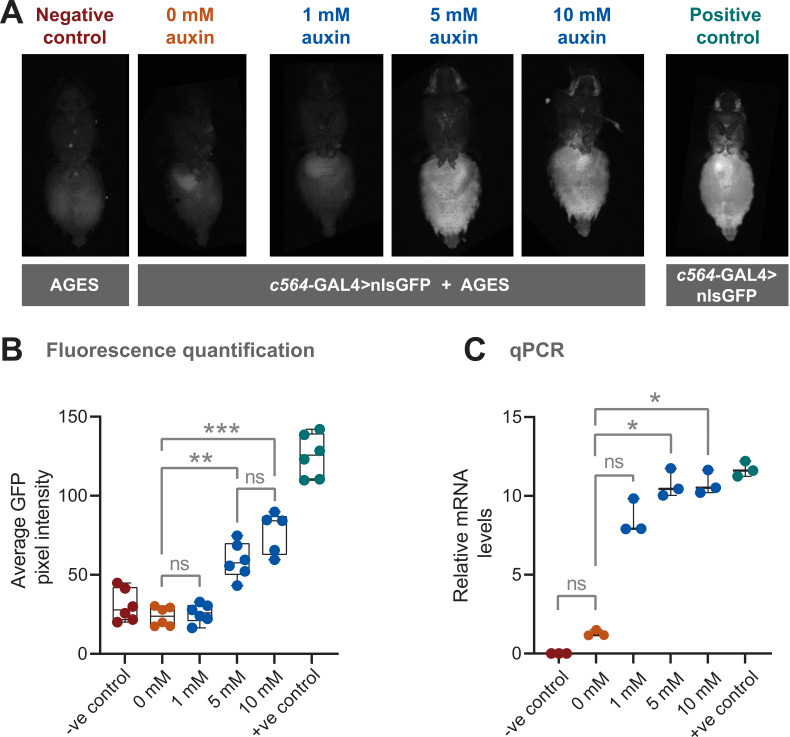
Figure 2—source data 1. GFP intensity and qPCR values for Figure 2B, C.

Figure 2.

Figure 2—figure supplement 1. Auxin-inducible gene expression system (AGES) effectively induces GAL4 activity in Drosophila adult males.

Figure 2—figure supplement 1.

(A) Ventral images of live males that express GAL4 in fat body tissue. Ingestion of food containing auxin (24 hr) induces GAL4 activity and the expression of GFP. (B) Quantification of GFP levels (from six male abdomens). Pixel intensity thresholding was performed to isolate abdomens as regions of interest. The average pixel intensities were quantified and analysed using ordinary one-way ANOVA (**, p = 0.002, ****, p < 0.0001). (C) Quantitative PCR (qPCR) data for GFP mRNA levels using different concentrations of auxin (three biological replicates). Values were normalised to housekeeping gene RpL4 (Ribosomal Protein L4) and relative expression levels were calculated using the ΔΔCt method. Y-axis displaying ΔΔCt values and statistics done using ordinary one-way ANOVA (**, p < 0.005).
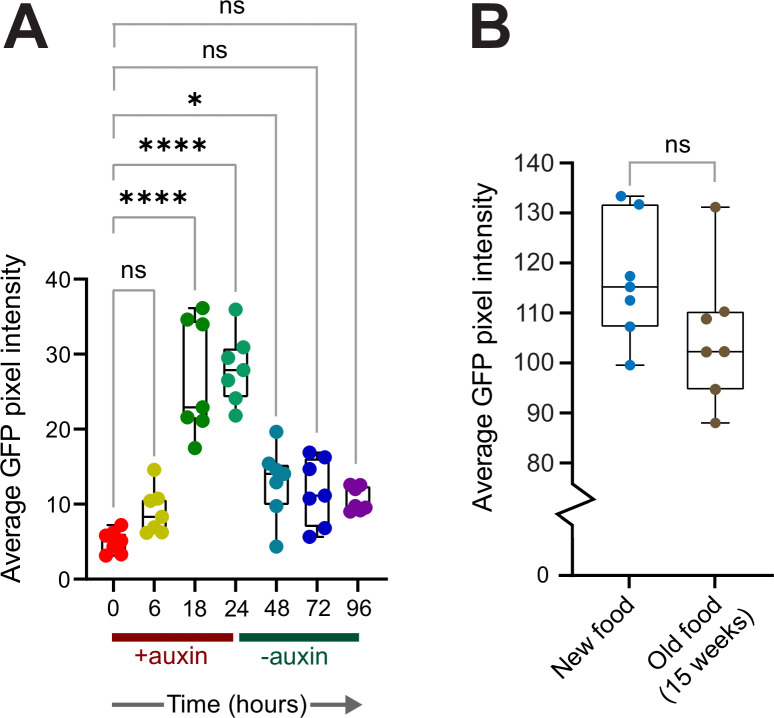
Figure 2—figure supplement 2. On-off dynamics of auxin-inducible gene expression system (AGES) in adult flies and stability of auxin fly food.

Figure 2—figure supplement 2.

(A) Quantification of GFP levels in female abdomens (expressed in the fat body). Pixel intensity thresholding was performed to isolate abdomens as regions of interest. The average pixel intensities were quantified and analysed using ordinary one-way ANOVA (*, p < 0.05, ****, p < 0.0001). (B) Quantification of GFP levels in female abdomens with freshly made auxin food and 15-week-old food.