. 2022 Apr 1;11:e67598. doi: 10.7554/eLife.67598

Figure 6. Auxin-inducible gene expression system (AGES) induced expression of Kir2.1 in PDF+ clock neurons ablates circadian locomotor rhythms.

(A, B) Representative double-plotted actograms for 5- to 10-day-old male flies maintained on standard food (A) or food supplemented with 2 mm NAA (B) for 3 days in 12 hr light:12 hr dark (12:12 LD) and 7 days in DD. Left: parental control UAS-Kir2.1, centre: parental control PDF-GAL4; AGES, right: experimental PDF-GAL4/UAS-Kir2.1; AGES/+. Bars indicate LD cycle, grey shaded days indicate constant darkness. (C) Amplitude of circadian rest:activity rhythms on DD days 2–8 represented by fast Fourier transform (FFT) power at 24 hr for male PDF-GAL4;AGES > UAS-Kir2.1 flies and their parental controls on standard food (orange) and food supplemented with 2 mM NAA (blue). Points represent individual flies, box shows 25–75% confidence interval, median line, and outliers. (D) Twenty-four hr FFT power as in (C) for female PDF-GAL4;AGES > UAS-Kir2.1 flies and their parental controls. (E) Twenty-four hr FFT power for as in (C) male PDF-GAL4-Geneswitch > UAS-Kir2.1 flies and their parental controls maintained on vehicle control food (orange) and food supplemented with 466 mM RU-486 (red). (F) Twenty-four hr FFT power as in (E) for female PDF-GAL4-Geneswitch > UAS-Kir2.1 flies and their parental controls. For all panels, means were compared by two-way ANOVA by genotype and food substrate, see Figure 6—source data 1 for raw data, p-values, and key resource data. Means sharing the same letter are not significantly different from one another by Tukey’s post hoc test (p > 0.05).

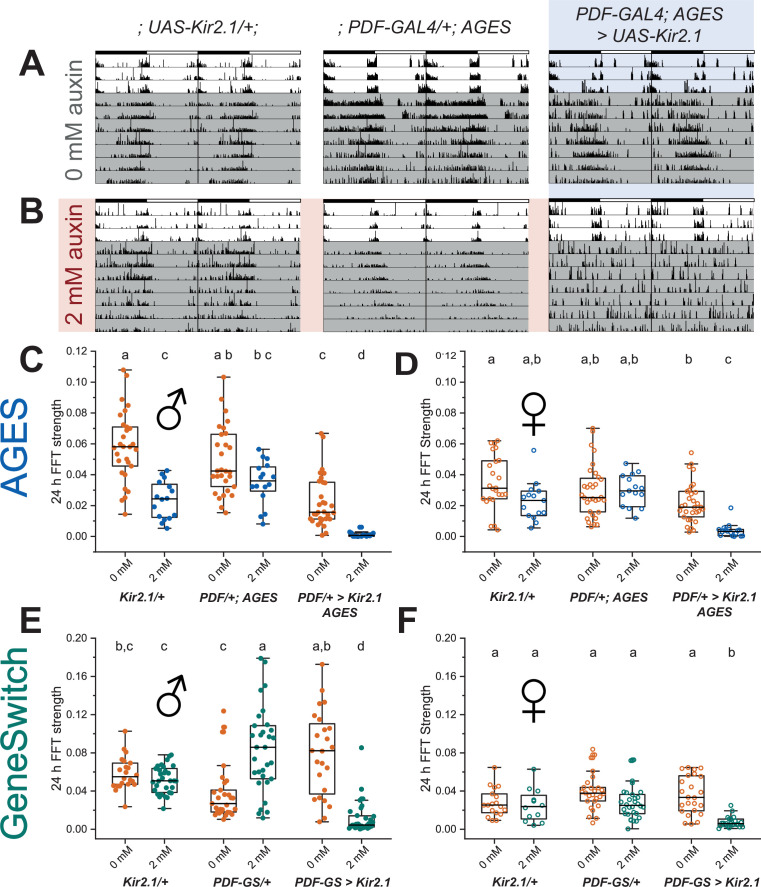
Figure 6—source data 1. Raw data, p values and key resource data for circadian and activity behaviourial experiments.

Figure 6.

Figure 6—figure supplement 1. Dose-dependent NAA effects on behaviour of auxin-inducible gene expression system (AGES) parental controls.

Figure 6—figure supplement 1.

Behavioural data for PDF-GAL4; AGES > UAS-Kir2.1 flies and their parental controls on standard food (orange), 2 mM NAA (blue) or 10 mM NAA (purple). (A, B) Twenty-four hr fast Fourier transform (FFT) power on DD days 2–8 for male (A) and female (B) PDF-GAL4; AGES > UAS-Kir2.1 flies. Two mM NAA data is replotted from Figure 6. Means were compared by two-way ANOVA by genotype and food substrate. Means sharing the same letter are not significantly different from one another by Tukey’s post hoc test (p > 0.05). (C, D) Period length for male (C) and female (D) flies. Means were compared by Student’s t-test for flies of the same genotype on different food substrates. (E, F) Average 24 hr activity counts for male (E) and female (F) flies. Means were compared by two-way ANOVA by genotype and food substrate. Means sharing the same letter are not significantly different from one another by Tukey’s post hoc test (p > 0.05). See Figure 6—source data 1 for raw data and p-values.
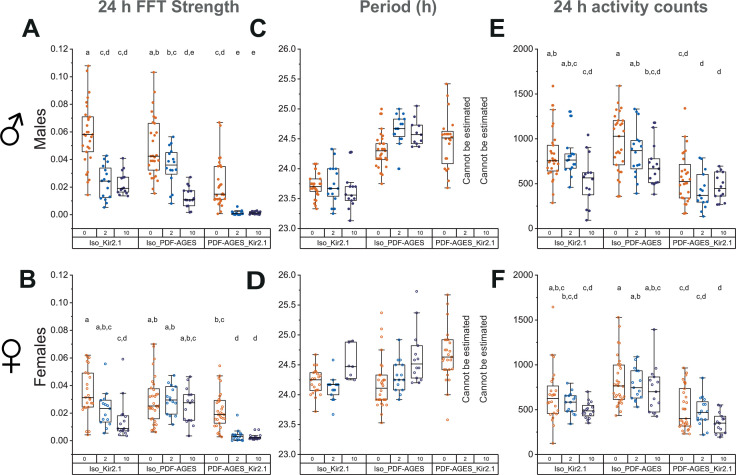
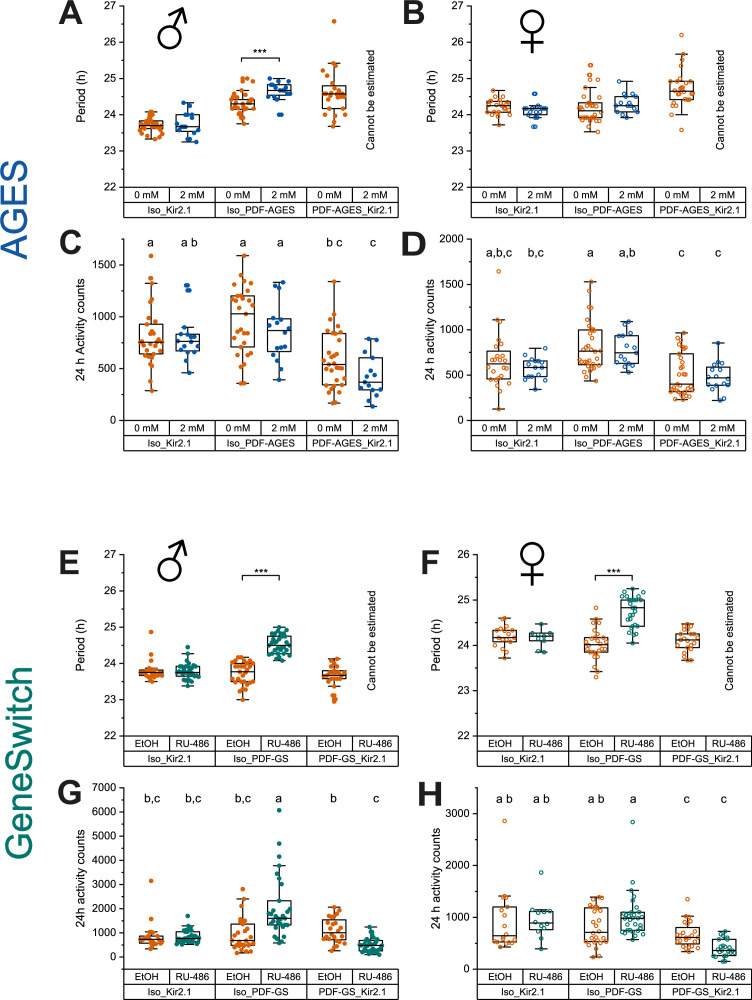
Figure 6—figure supplement 2. Effects of auxin-inducible gene expression system (AGES) and GeneSwitch induced expression of Kir2.1 in PDF+ clock neurons on circadian period length and average 24 hr locomotor activity.

Figure 6—figure supplement 2.

(A, B) Period length estimated by chi-squared periodogram on days 2–8 of DD for male (A) and female (B) PDF-GAL4; AGES > UAS-Kir2.1 flies and their parental controls on standard food (orange) and food supplemented with 2 mM NAA (blue). Means were compared by Student’s t-test for flies of the same genotype on different food substrates. (C, D) Average 24 hr activity counts on days 2–8 of DD for male (C) and female (D) PDF-GAL4; AGES > UAS-Kir2.1 flies and their parental controls on standard food (orange) and food supplemented with 2 mM NAA (blue). Means were compared by two-way ANOVA by genotype and food substrate, and Tukey’s post hoc test. Only genotype had significant effects on activity (p = 2.86 × 10⁻⁷) and there was no significant interaction effect. Means sharing the same letter are not significantly different from one another by Tukey’s post hoc test (p > 0.05). (E, F) Period length for male (E) and female (F) PDF-GAL4-Geneswitch > UAS-Kir2.1 flies and their parental controls maintained on vehicle control food (orange) and food supplemented with 466 mM RU-486 (teal). Statistics as in panels A and B. (G, H) Average 24 hr activity counts for male (G) and female (H) PDF-GAL4-Geneswitch > UAS-Kir2.1 flies and their parental controls maintained on vehicle control food (orange) and food supplemented with 466 mM RU-486 (teal). Statistics as in panels C and D. Genotype had significant effects on activity in both males and females (p = 4.48 × 10⁻⁷, p = 3.60 × 10⁻², respectively) and there was a significant interaction between the effects of genotype and food substrate in both males and females (p = 0.007, p = 3.76 x 10⁻⁹, respectively). See Figure 6—source data 1 for raw data and p-values.