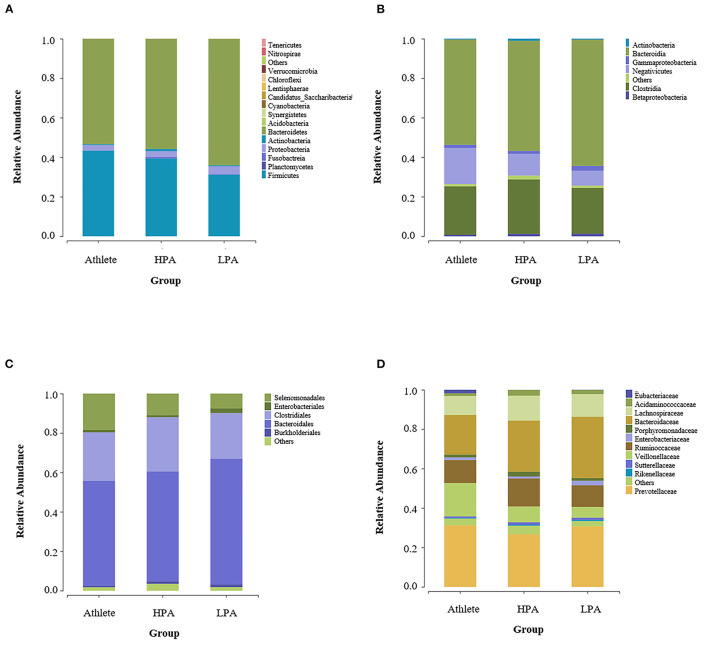
Figure 2.
Differences of gut microbiota relative abundance at the phylum, class, order, and family levels among three groups. Relative abundance represents the proportion of each species in each group. (A) phylum level; (B) class level; (C) order level; and (D) family level. Athlete, Athlete group; HPA, High physical activity group; LPA, Low physical activity group.

