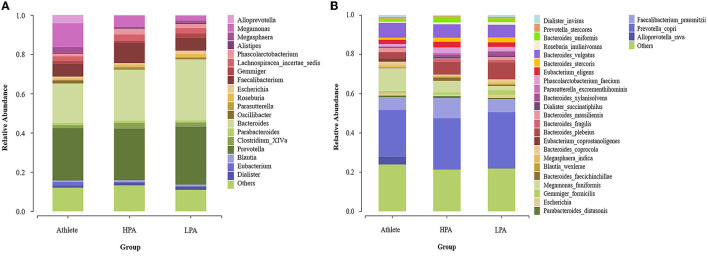
Figure 3.
Differences of gut microbiota relative abundance at the genus and species level among three groups. Relative abundance represents the proportion of each species in each group; (A) genus level; (B) species level; Athlete, Athlete group; HPA,High physical activity group; LPA, Low physical activity group.

