
Figure 6.
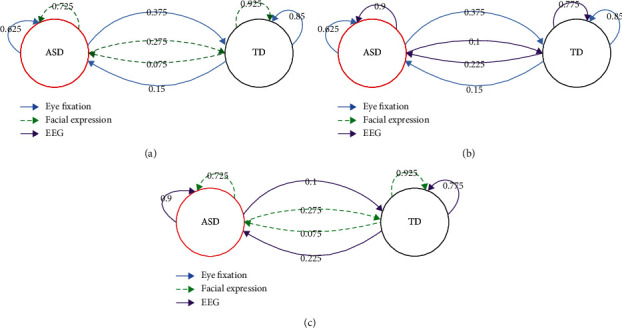
Confusion graph of single modality, showing their complementary characteristics for identification ASD and TD. The numbers represent the percentage of samples in the class of arrow tail predicted as the class of head. (a) The complementary characteristics of eye fixation and facial expression. (b) The complementary characteristics of eye fixation and EEG. (c) The complementary characteristics of facial expression and EEG.