Figure 1.

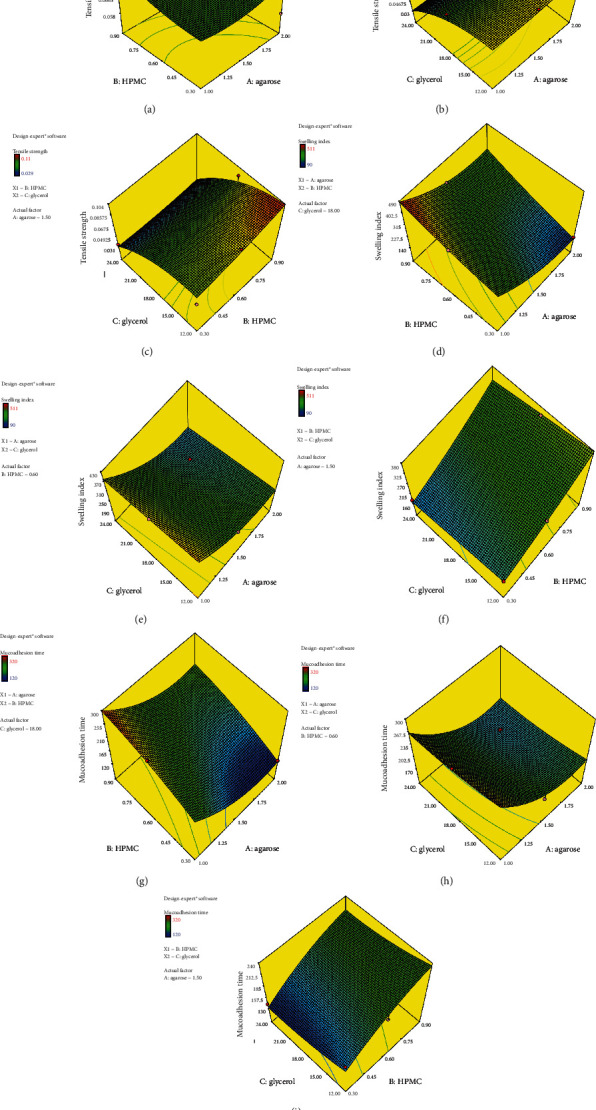
Response surface plots, tensile strength (a, b, c), swelling index (d, e, and f), and ex vivo mucoadhesion time (g, h, and i).

Response surface plots, tensile strength (a, b, c), swelling index (d, e, and f), and ex vivo mucoadhesion time (g, h, and i).