Figure 10.

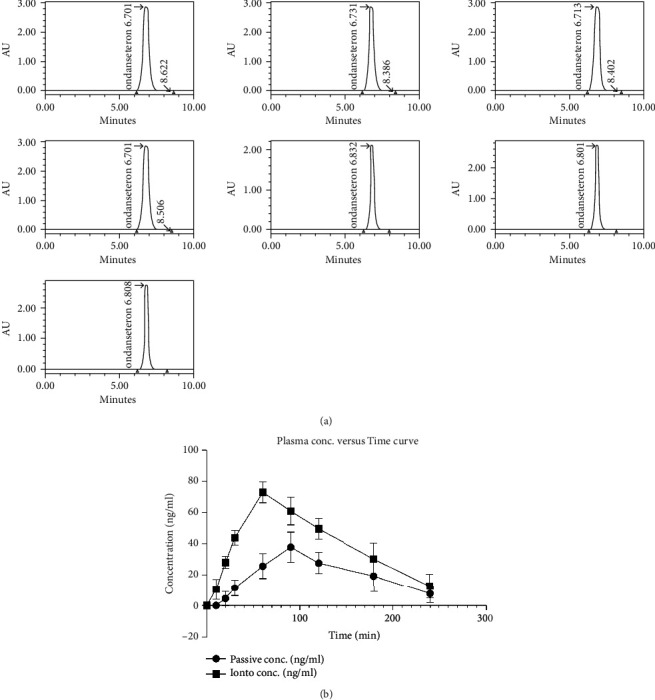
(a) The chromatograms of ondansetron hydrochloride. (b) The plasma concentration versus time curve of both the passive and ionto animal groups.

(a) The chromatograms of ondansetron hydrochloride. (b) The plasma concentration versus time curve of both the passive and ionto animal groups.