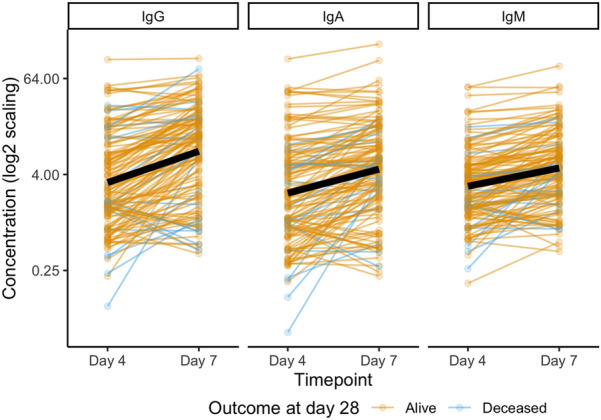
Fig. 1.

Plasma anti-SARS-CoV-2 RBD IgG, IgM, and IgA on days 4 and 7 of patients (n = 137) hospitalized for acute COVID-19. Line color denotes whether a patient was alive at day 28 (n = 120, yellow) or deceased (n = 17, blue), with the average trajectory noted as a thick black line
