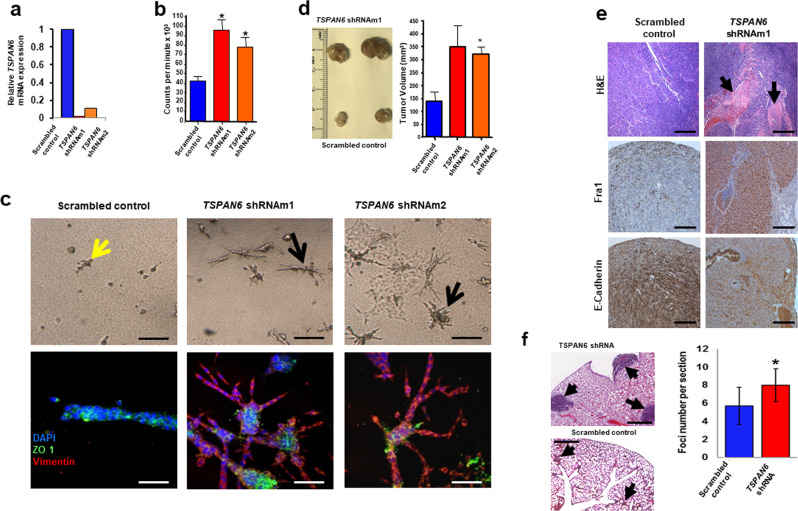
Fig. 2. Tspan6 knockdown in EpRas mouse mammary epithelial cells affects cell polarity, proliferation, and invasion.
a Efficacy of shRNA mediated Tspan6 knockdown in murine mammary epithelial EpRas cells. Data for two different shRNA knockdown lines, termed shRNAm1 and shRNAm2, are shown relative to the scrambled shRNA control. Cells were transfected using a lentiviral approach. Data were obtained by qPCR. b Proliferation of EpRas mammary cancer cells infected with lentiviral vectors encoding two distinct shRNAs targeting Tspan6, or scrambled shRNA as a control. Proliferation was determined in triplicate at 8 h using tritiated thymidine incorporation (mean ± SEM). Experiments were conducted twice. c Knockdown of Tspan6 results in EMT in H-RasV12 transformed epithelial EpRas cells. Top panels show representative cell morphologies of EpRas cells transfected with scrambled shRNA (control) or two distinct shRNAs targeting Tspan6 5 days after seeding of 5 × 10³ cells in collagen gels. Experiments were conducted twice. Yellow arrow indicates typical tubular structures. Black arrows indicate spindle-like cell morphologies indicative of EMT. Lower panel shows immunostaining for the epithelial marker ZO-1 (green) and the mesenchymal marker vimentin (red). DAPI (blue) is shown to label nuclei. Images were taken by confocal microscopy. Scale bars, 80μM top panels, 50μM bottom panels. d Left: Representative macroscopic appearances of tumors from control EpRas and Tspan6 knockdown EpRas cells 4 weeks after inoculation. EpRas cells transfected with lentiviruses targeting Tspan6 or scrambled shRNA (control) were inoculated in mammary fat pads of female nu/nu hosts (2.5 × 10⁵ cells each). Experiments were conducted twice. Right: Mean tumor volume 4 weeks after inoculation (n = 8 per group). *P < 0.05 (Student’s t test). e In vivo tumor growth, and effect on Fra1 and E-cadherin expression. Top panel, Hematoxylin and Eosin (H&E) staining of cross tumor sections from designated xenografts. Black arrows indicate large necrotic areas formed by EpRas Tspan6 shRNA cells. Middle panel, Fra1 immunostaining in tumors from control EpRas and Tspan6 knockdown EpRas cells showing that the Ras pathway target, Fra1 is upregulated in Tspan6 knockdown tumors. Bottom panel, E-cadherin immunostaining in tumors from control EpRas and Tspan6 knockdown EpRas cells indicate dissolution of adherens junction upon Tspan6 knockdown. Representative images are shown at 4 weeks after injection into female nu/nu hosts. Scale bars = 1000 μM. f Lung metastases of control (scrambled shRNA) and Tspan6 knockdown murine EpRas epithelial cells 30 days after tail vein injection of 5 × 10⁵ cells/mouse. Arrows indicate metastases. Scale bar is 1000 µm. For quantification (right panel), at least ten different planes from each lung were H&E stained and analyzed in a blinded fashion. Data are from at least 4 mice per genotype, and experiments were conducted twice. Mean foci numbers ± s.e.m. per lung section are shown. *p < 0.05 (Student’s t test).

