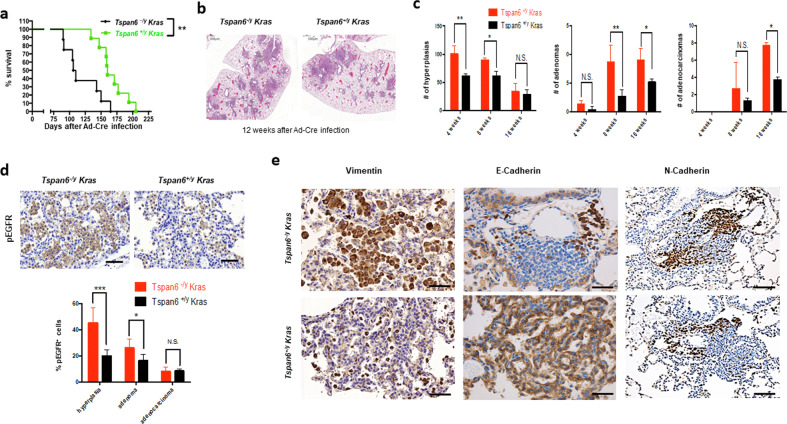
Fig. 5. Tspan6 is a tumor suppressor in KRasG12D-driven lung cancer.
a Kaplan–Meier survival plots for whole-body Tspan6-/y KrasG12D mice (n = 8) and TSPAN6+/y KrasG12D (n = 9) littermate controls. Log-rank test was used for statistical analysis. **P < 0.01. b Representative histological H&E sections of Tspan6-/y KrasG12D and Tspan6+/y KrasG12D lungs 12 weeks after Ad-Cre infection. Magnifications x5. c Quantification of hyperplasic regions, adenomas, and adenocarcinomas in Tspan6-/y KrasG12D and Tspan6+/y KrasG12D lungs at the indicated time points following Ad-Cre inhalation. n = 5 for each cohort and time point analyzed. Data are shown as means ± s.e.m. * P < 0.05; ** P < 0.01; N.S. = not significant (Student’s t test). d Representative in situ immunostaining for phosphorylated EGFR (pEGFR) 8 weeks post Ad-Cre delivery to lungs of Tspan6-/y KrasG12D (n = 5) and Tspan6+/y KrasG12D mice (n = 5). Right panel shows quantification of % pEGFR+ cells in hyperplasic regions, adenomas, and adenocarcinomas. Data are shown as mean ± s.e.m. * P < 0.05; ***P < 0.001; N.S. = not significant (Student’s t test). Scale bars = 200 μM. e Representative immunostaining for the mesenchymal markers, vimentin, and N-cadherin, and the epithelial marker E-cadherin in lung tumors 8 weeks after Ad-Cre inhalation. Sections were counterstained with haematoxylin. Scale bars, top left panel = 100 μM, bottom left panel = 200 μM, middle panels = 200 μM, right panels = 500 μM.

