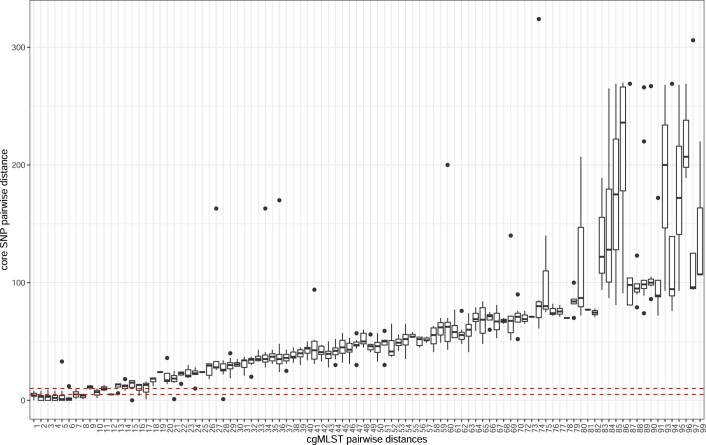
Extended Data Fig. 6. The correlation between pairwise genetic distances measured by core genome single nucleotide polymorphisms (cgSNPs) and core genome multi locus sequence typing (cgMLST) of pairs of isolates with ≤ 100 cgMLST and ≤ 1000 cgSNPs.
73% of pairs with ≤ 10 cgMLST loci apart (n = 109) were separated by ≤ 4 cgSNPs while 97% (n = 145) of these ≤10 cgMLST pairs were separated by ≤10 core SNPs. Only one pair had more than 13 cgSNPs. Two horizontal red dotted lines indicate 4 and 10 cgSNPs. Boxplot centre lines show median value; upper and lower bounds show the 25th and 75th quantile, respectively; upper and lower whiskers show the largest and smallest values within 1.5 times the interquartile range above the 75th percentile and below the 25th percentile, respectively; and points show show samples outside the whisker range.

