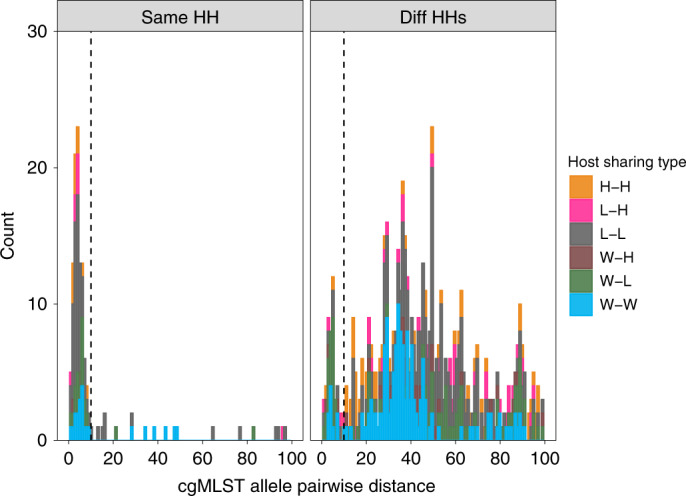
Fig. 3. Frequency distribution of pairwise distances among isolates from the same household and from different households.

cgMLST allele pairwise distances among isolates from the same household (HH; left) and from different (Diff) HHs (right). The sources of isolates in each pair are indicated by the colour. Only pairs that are closer than 100 cgMLST loci apart are shown. The vertical dashed black line indicates the sharing threshold (10 cgMLST alleles). H, human; L, livestock; W, wildlife.
