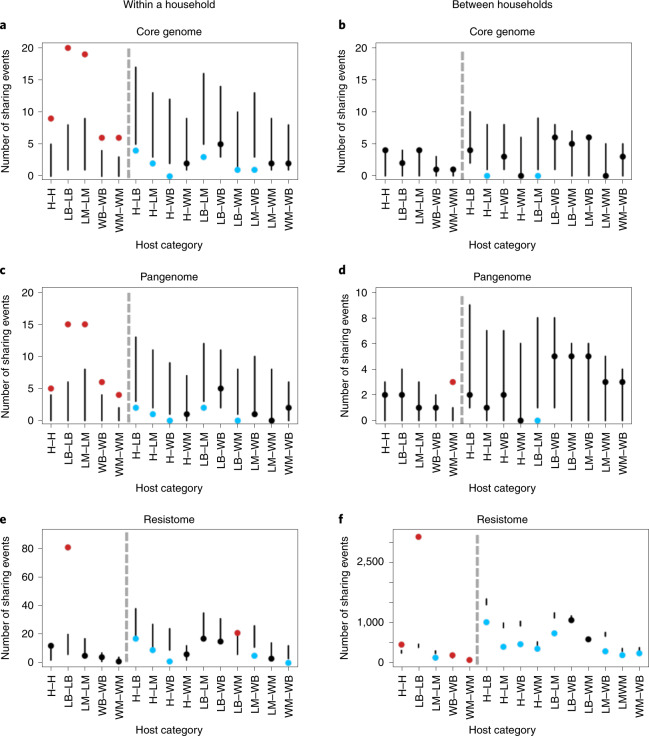
Fig. 4. Number of sharing pairs for core genomes, pangenomes and resistomes within and between households.
a,c,e, Number of within-household sharing pairs across 15 host category types for core genomes (a) (n = 121), pangenomes (c) (n = 94) and resistomes (e) (n = 9,502). b,d,f, Number of between-household sharing pairs across 15 host category types for core genomes (b) (n = 121), pangenomes (d) (n = 94) and resistomes (f) (n = 9,502). Panels show the 95% confidence intervals (vertical lines) of the calculated expected distribution using a resampling approach. Points depict the observed number of sharing pairs in each category coloured according to whether they fall above (red), below (blue) or within (black) the expected distribution. Hosts in the same category (for example, H–H) and different categories (for example, H–LB) are separated by grey dashed lines. Source type of isolate pairs is indicated on the x axis with human (H), livestock birds (LB), livestock mammals (LM), wildlife birds (WB) and wildlife mammals (WM). In each plot, within-category connections are on the left of the grey dotted line and between-category connections are on the right.

